Low savings rate, falling deposits and levered-up consumers could be a precursor to a pullback in spending.

Later this morning, May’s personal income/spending data will be published. This series also contains the PCE (personal consumption expenditures) price index measuring inflation. Core PCE is the Federal Reserve’s favorite. This is where markets’ focus lies. But there is something else that at this point in the cycle should deserve equal – if not more – attention.
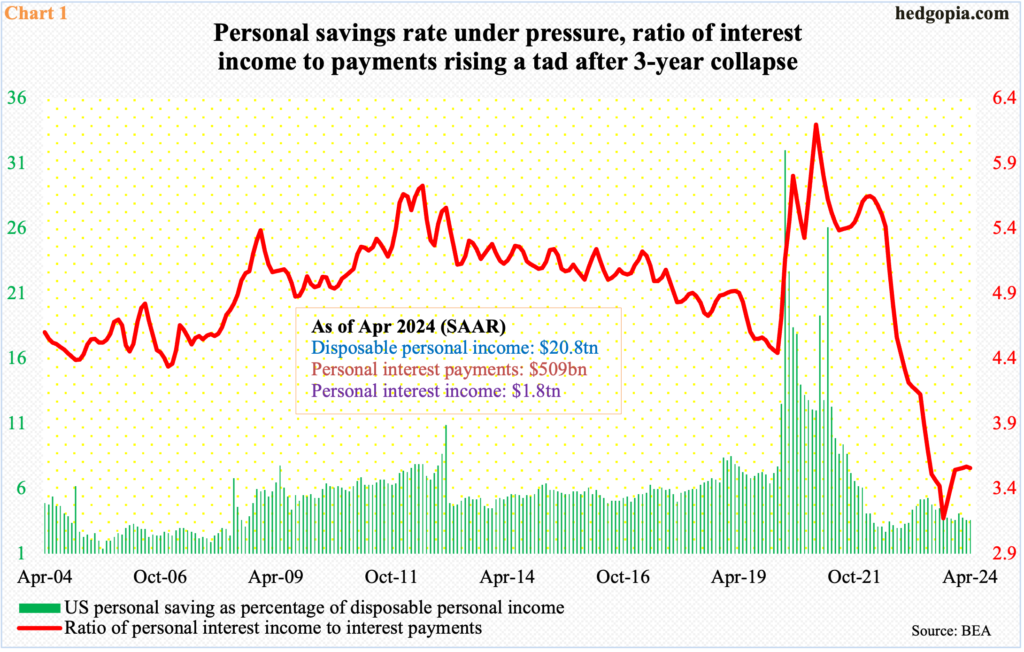
The personal savings rate in April stood at 3.6 percent. This is low. In June 2022, this metric dropped as low as 2.7 percent, but has been unable to meaningfully rise from that level. Going all the way back to January 1959, the savings rate has averaged 8.5 percent, which was pushed up by the unreasonably high savings seen in 2020; back then, it surged as high as 32 percent in April, as Covid-19 stimulus flooded the system.
That was also a time when a ratio of personal interest income to interest payments hit 6.2 – the highest since May 1995 – before coming under sustained pressure to hit 3.2 last September. The ratio has tried to stabilize since (Chart 1).

Interest rates are front and center as far as the ratio of interest income to payments goes. How rates evolve from here will therefore have a bearing on this, as it will on interest-bearing and non-interest-bearing deposits.
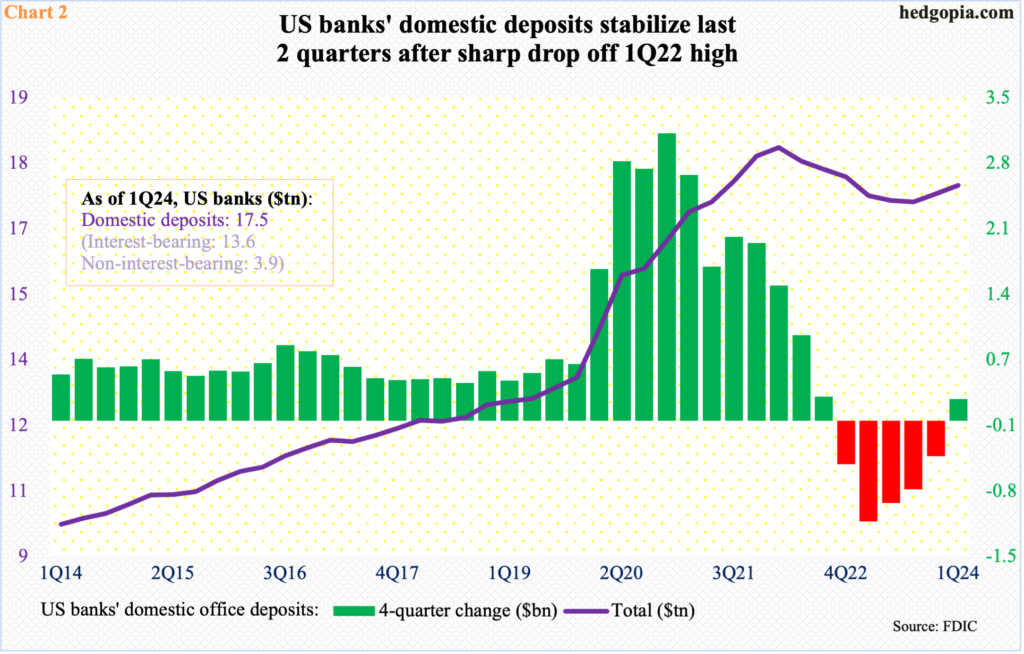
At the March quarter, US banks held $13.6 trillion in interest-bearing and $3.9 trillion in non-interest-bearing, with the former at a new high and the latter having peaked at $5.5 trillion in 1Q22. The Fed began to raise the fed funds rate from a range of zero to 25 basis points in March 2022; last July, it stopped the tightening campaign at 525 basis points to 550 basis points. This jump in the benchmark rates impacted the balance between interest-bearing and non-interest bearing.
The overall deposits, too, peaked in 1Q22 at $18.4 trillion, having gone parabolic from the 4Q19 total of $13.2 trillion; once again, this was just before the Covid-19 stimulus hit households’ pocketbooks. After that 1Q22 peak, the deposit base then shrank to $17.2 trillion in 3Q23 before rising a little to end 1Q24 at $17.5 trillion (Chart 2).
Importantly, the four-quarter change in deposits went negative for five quarters before going green again in the March quarter. It is early but could be a sign that the deposit base is trying to stabilize.

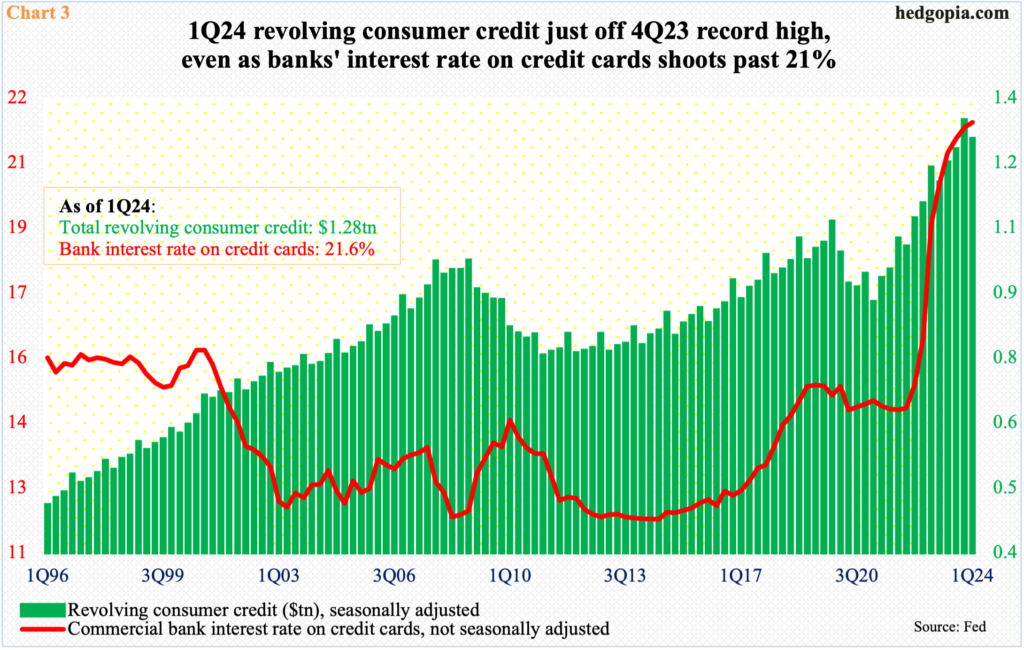
Higher rates obviously are hurting consumers. As can be seen in Chart 3, banks’ interest rate on credit cards went parabolic as the Fed’s tightening campaign began. In 4Q21, commercial banks were charging 14.5 percent on credit cards; by last quarter, this had shot up to 21.6 percent (Chart 3).
Ironically, this has not stopped consumers with low savings and shrinking deposits from demanding more credit. In 1Q24, revolving consumer credit – such as credit cards – fell slightly to $1.28 trillion from the December quarter’s record $1.32 trillion. At the end of 2021, this stood at $1.05 trillion.
Skyrocketing credit and sharply rising rates do not go well together. But this is the reality right now. To what extent the Fed will be willing to cut rates in the quarters ahead will decide how this resolves. Consumers are beginning to get stretched – particularly at the low-end – and this could be a precursor to a pullback in spending.
Thanks for reading!

