
Interesting dynamics are at play in U.S. housing.
Sales of both existing and new homes are decent, but price has galloped ahead. Add to that household formation and supply of homes, housing could very well be at an interesting juncture.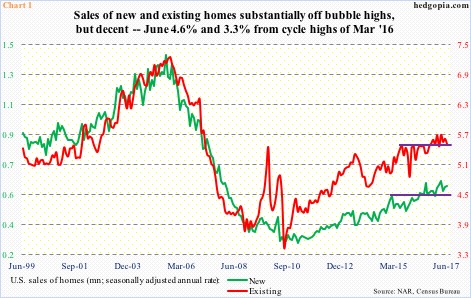
New home sales rose 0.8 percent month-over-month in June to a seasonally adjusted annual rate of 610,000 units. The 638,000 in March this year was the highest since November 2007 (Chart 1).
Similarly, existing home sales in June fell 1.8 percent m/m to 5.52 million units (SAAR). Once again, at 5.7 million units March was a cycle high – the highest since February 2007.
That said, sales are nowhere near bubble highs – existing peaked at 7.26 million in September 2005 and new at 1.39 million in July 2005.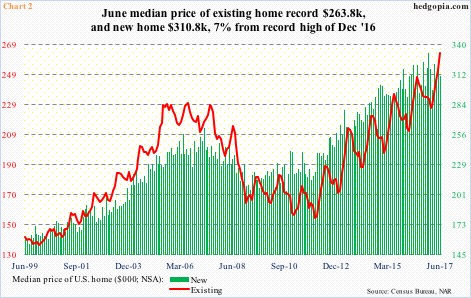
The median price, however, is well past the bubble highs.
In June, a new home cost $310,800, down 4.2 percent m/m. The all-time high of $332,700 was recorded last December (Chart 2).
Along the same lines, the median price of an existing home in June jumped 4.5 percent m/m to $263,800, a new record.
This rate of price appreciation cannot be conducive to sales. Not to mention household formation.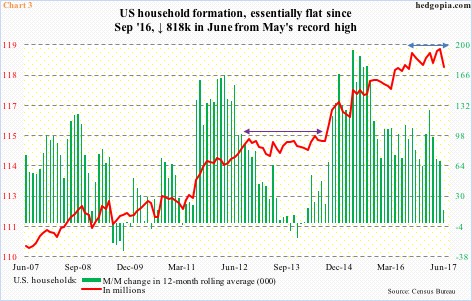
After going sideways for two years (violet bi-directional arrow in Chart 3), U.S. household formation broke free in September 2012. Barring normal ups and downs, the red line trended higher – until September last year, when another sideways move may have begun (blue bi-directional arrow).
In June, household formation fell by a massive 818,000 units to 118.4 million from May’s record 119.2 million. This was the largest m/m drop since July 2009 when households dropped by a million.
Monthly data can be volatile.
Using a 12-month rolling average, June was 118.7 million, up 14,000 m/m to a new high. But the momentum is in deceleration, evident in the green bars in Chart 3.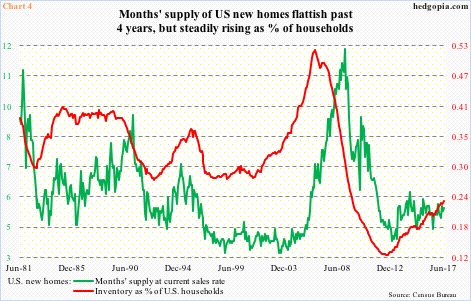
One of the reasons behind the rapid increase in home price is lack of supply. In June, seasonally adjusted months’ supply of new homes stood at 5.4 – essentially flat the past four years (Chart 4).
But as a percent of household formation, the supply of new homes is trending higher, which is what the red line in Chart 4 shows. It was 0.23 percent in June, rising from 0.124 percent in July 2012.
In other words, inventory is inching up – likely because hew households are not being formed at a rapid enough pace.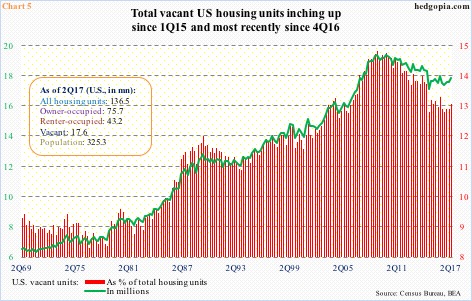
This same phenomenon is also seen in Chart 5.
As of 2Q17, U.S. housing units totaled 136.5 million units. Of this, 118.9 million were occupied, consisting of 75.7 million owner-occupied and 43.2 million renter-occupied, resulting in 17.6 million that are vacant.
Vacant homes peaked at 19.1 million in 1Q09, before coming under pressure. They bottomed at 16.8 million in 4Q14 and at 17.1 million in 3Q16 after that, then rising to 17.6 million by 2Q17 (Chart 5).
The bias seems up in the green line. Too soon to say if this will begin to adversely impact the price, but should that happen, it will be a blessing in disguise for U.S. housing.
Thanks for reading! Please share.
