
U.S. stocks have done phenomenally well since the February lows. In less than six months through the intra-day high yesterday, the S&P 500 large cap index has rallied north of 20 percent, the Nasdaq 100 index 22.5 percent, and the Russell 2000 small cap Index nearly 30 percent. The irony: operating earnings estimates for 2016 shrank from nearly $120 back then to $112.85 now.
Multiples have expanded.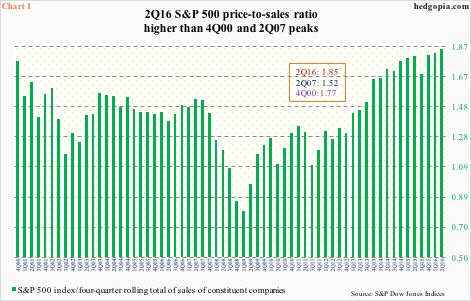
Using trailing 12 months, the price-to-sales ratio surged to 1.85 in 2Q16. This was the highest ever, and much higher than the prior two peaks – 1.77 in 4Q00 and 1.52 in 2Q07 (Chart 1). Also using trailing 12 months, the S&P 500 trades at 21.1x operating earnings and 23.9x reported; using forward 12 months, multiples drop to 16.8x and 18.2, respectively, but still not cheap, although they compare well versus trailing. But how trustworthy are forward estimates?
Not much, going by the revision trends.
Actual operating earnings came in at $100.45 in 2015, down from $113.02 in 2014. Back in 2Q14, 2015 was expected to earn $137.50; the gap between what was expected and what was earned was 27 percent! Similarly, 2016 in 4Q14 was estimated at $137.50, which has now been cut down to $112.85. Even 2017, started out at $141.11 in the middle of January this year has so far been slashed to $133.16 (Chart 2).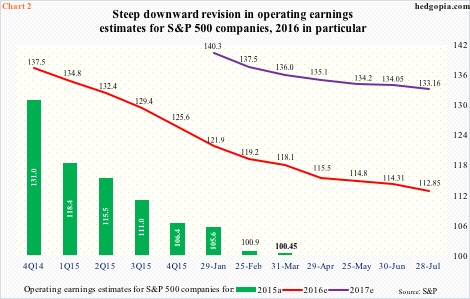
Reasons are plentiful. Ever since Great Depression ended, economists for the most part have been looking for an escape velocity that keeps eluding. Be it jobs, capital expenditures, capacity utilization, or gross domestic product, the cycle is sub-par. The sell-side keeps hoping next year would be different, but keeps getting disappointed, as the hoped-for growth in earnings does not materialize.
Two other sources of disappointment have been the U.S. dollar and oil.
The US dollar index rallied nearly 26 percent to 100.71 between July 2014 and March 2015. Since that high, it has essentially traded within a range, with 92-93 on the low end. Similarly, between June 2014 and February this year, spot West Texas Intermediate crude collapsed nearly 76 percent. From that low, the crude nearly doubled, before coming under renewed pressure for nearly two months now.
The point is, the dollar index is flattish for a year and a half, and crude oil is off its lows. Depending on how things shake out for the rest of the quarter, and/or the second half, odds favor both act as a tailwind, or at least not act as a headwind. Hence the elevated estimates for 2H.
As things stand, 3Q16 is expected to grow 18.4 percent year-over-year to $30.13, and 4Q16 36.7 percent to $31.53. Granted 2H15 earnings were suppressed, but is the expected growth rate in the current half achievable? Too soon to tell. In 2015, spot WTI started 3Q at $59/barrel and ended at $45 and change. This year, it traded at $48-plus at the beginning of 3Q and was trading at $40.06 yesterday. Momentum is currently down. Unless it reverses and rallies big, the expected bump from oil may not be there in at least 3Q16.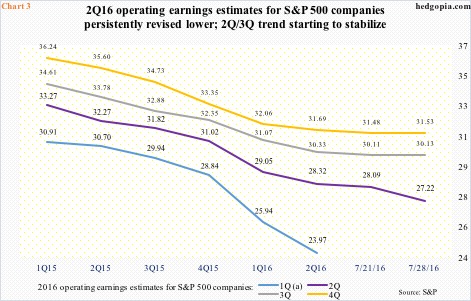
This is not a scenario currently built into the consensus. Chart 3 shows quarterly progression of 2016 operating earnings estimates. In the latest week (as of July 28th), 2Q estimates continued to head lower. Estimates for 3Q and 4Q, however, have begun to stabilize – flattish to even slightly up. If – big IF – this is a trend, what is seen in Chart 4 may not be an aberration.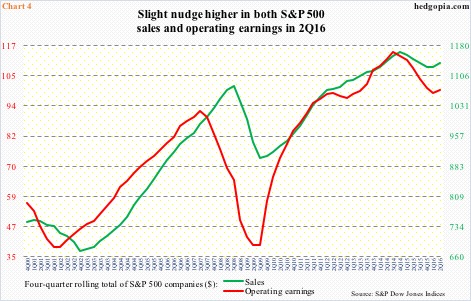
Chart 4 presents a four-quarter rolling total of both sales and operating earnings for S&P 500 companies. Most recently, they respectively bottomed at $1,127.12 in 4Q15 and $98.61 in 1Q16, versus $1,135.69 and $99.69 in 2Q16. In other words, they have both hooked up a tad.
Ditto with operating margins for S&P 500 companies, which inched up from 8.74 percent in 1Q16 to 8.78 in 2Q16 (not shown here). This is minuscule, but at the same time is the first sequential increase since margins peaked at 9.92 percent in 3Q14. That was the quarter operating earnings peaked at $114.51 (four-quarter rolling total), and when corporate profits adjusted for inventory and depreciation peaked at a seasonally adjusted annual rate of $2.16 trillion.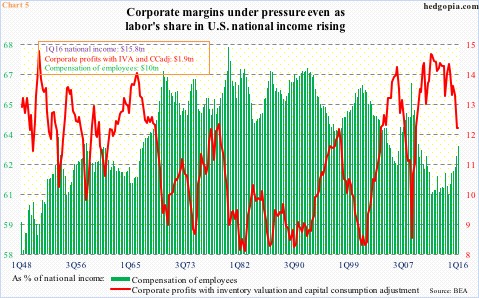
Corporate margins have been under pressure for a while – since 1Q12, and particularly since 3Q14 (Chart 5). Both 4Q15 and 1Q16 were at 12 percent – once again sideways. Hence the significance of what is seen in Chart 4. Chart 5 is as of 1Q16. If the trend seen in S&P 500 companies holds up, the red line in Chart 5 may begin to hook up as well, which, needless to say, is positive for corporate profitability. This better be the case as a lot is riding on 2H this year. Expectations are high, and those lofty estimates better come through.
Thanks for reading!
