
Several asset classes are at crucial juncture.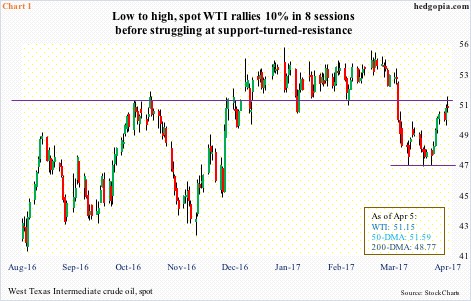
Wednesday, West Texas Intermediate crude rallied to $51.88 before closing at $51.15, up 0.2 percent (Chart 1). The session produced a long-legged doji, took out now-slightly-declining 50-day moving average intraday but closed the session under.
The crude is giving out signs of fatigue, at least near term. From low to high, it rallied 10 percent in eight sessions. Daily conditions are now overbought. All this is taking place at/near an important price level.
Bulls and bears have been fighting a tug of war at $51-$52 for the past couple of years. The former lost that support a month ago. Near-term odds favor the latter.
The EIA report out Wednesday showed U.S. crude stocks continued to build, up 1.6 million barrels to a new record 535.5 million barrels.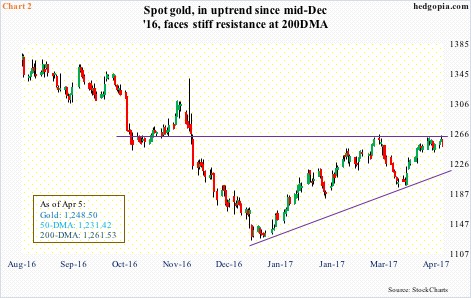
Also on Wednesday, FOMC minutes showed the Fed wants to continue to raise rates and at the same time would like to work toward reducing its massive $4.5-trillion balance sheet – double-tightening, so to speak. Simplistically, both are gold negative – or at least that is how the majority views it.
Wednesday, the metal shed 0.8 percent (Chart 2). This followed an unsuccessful test Tuesday of the 200-day moving average – a third test since February 27. This was preceded by a 12-plus-percent rally since December 15 last year. (The Fed hiked rates on December 14.)
This is as good a spot as any for the metal to take a rest. The 50-day – still slightly rising – rests at $1,231.42, and likely gets tested near term.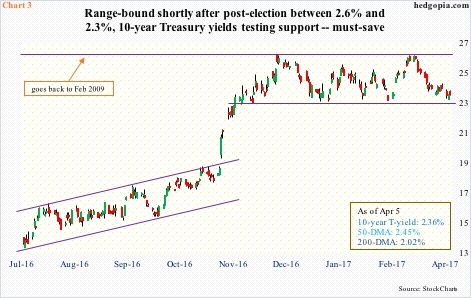
Also on December 15, 10-year Treasury yields hit 2.62 percent before coming under pressure. This is Janus Capital’s Bill Gross’s line in the sand. Resistance goes back to February 2009, and was tested again on March 13 – again unsuccessfully. (The FOMC met on March 14-15, and hiked again – third 25-basis-point hike since December 2015.)
While bond bulls were defending 2.62 percent, the bears were not in a mood to let go of 2.31 percent either. As a result, 10-year yields have been playing ping pong between these levels. Tuesday, they fell to 2.32 percent before finding bids (Chart 3).
As things stand, a loss of this support can prove to be important not only for bonds but for other assets as well. For one, this would mean the yield curve would continue to narrow, and that probably does not bode well for financials.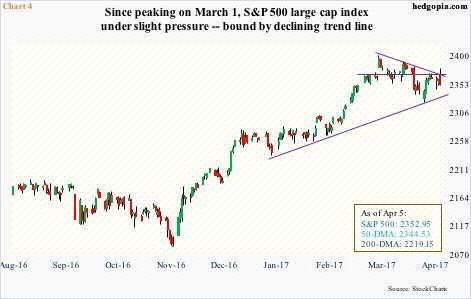
This is particularly so as major U.S. equity indices themselves are sitting at crucial juncture.
In the last eight sessions, the S&P 500 (Chart 4) and the Dow Industrials tested their respective 50-day moving average twice already. The Russell 2000 small cap index – range-bound the last four months – is once again testing support. The Nasdaq composite (5418.52) acts the strongest of the four, but near term likely wants to go test the 50-day – one percent away.
On all these indices, their respective support levels are a must-save.
They have priced in a lot post-election. The Trump administration’s efforts to reform/repeal the Obamacare failed. And there are no concrete plans yet as regards to tax cuts and/or infrastructure spending.
With all this as a background, the 2.3-percent support on 10-year yields likely holds the key near term. A loss likely sets off rotation away from stocks in particular, making the afore-mentioned support on the four indices vulnerable.
Thanks for reading!
