
Two important data points came out last week and both are acting as headwinds. Margin debt and foreigners’ buying behavior are likely to continue to maintain the current trajectory medium- to long-term. Near-term, technical indicators are oversold, with the S&P 500 closing out last week just above horizontal support.
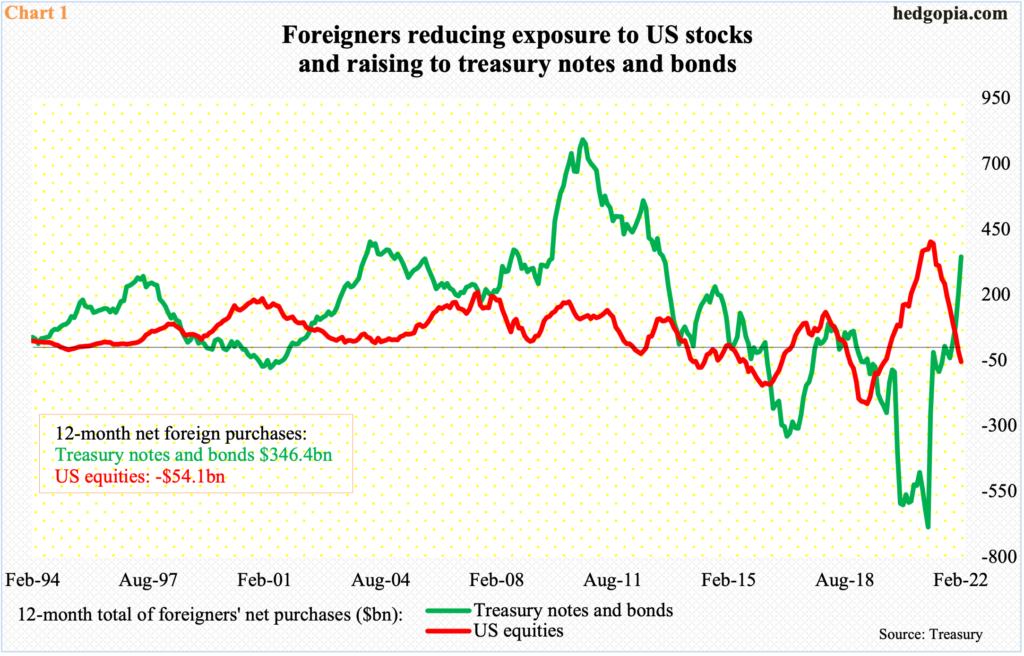
Foreigners are actively cutting exposure to US stocks and raising to treasury notes and bonds. This has been going on for a while now.
In the 12 months to February, foreigners purchased $346.4 billion in treasury notes and bonds. This is quite a U-turn in their sentiment as only a year before that they were selling $685.1 billion worth – a record. Around that time, they were heavily net long US equities, with the 12-month total to March 2021 of a record $404.7 billion; fast forward to January, the metric went negative, with February at minus $54.1 bullion (Chart 1).
Foreigners are no longer a source of tailwind for US stocks.
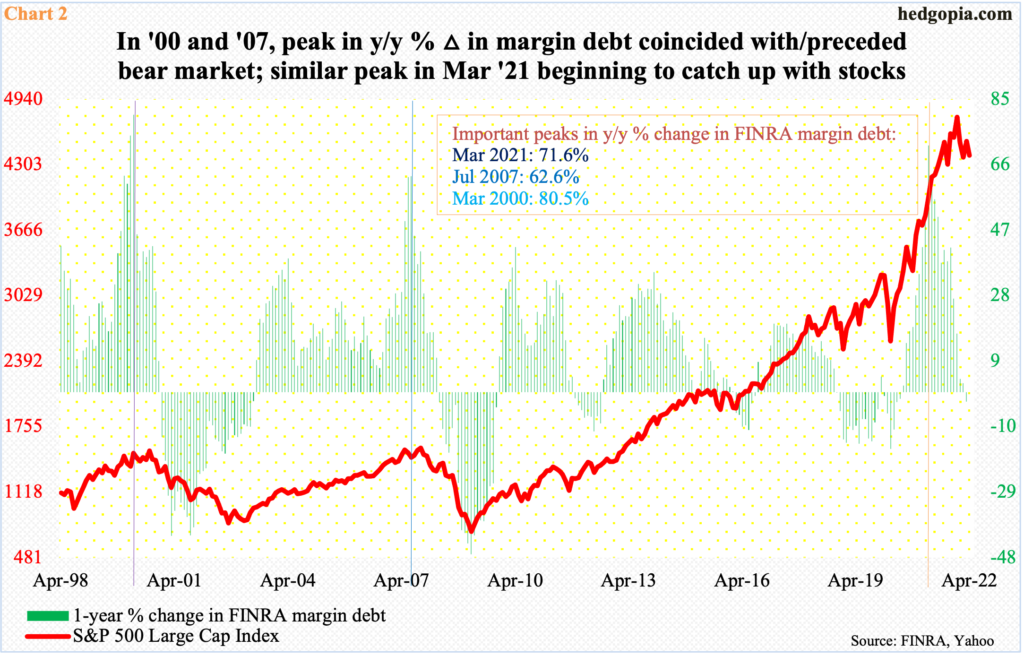
Margin debt is acting the same way.
Last October, FINRA margin debt posted a fresh all-time high of $935.9 billion, which more than doubled from the post-pandemic low of $479.3 billion posted in March 2020. From that peak through March (this year), margin debt then dropped $136.2 billion, to $799.7 billion, for a year-over-year drop of 2.8 percent. This was the first y/y decline in 21 months.
If past is precedent, the green histograms in Chart 2 should continue to persist in negative territory. In the current cycle, the y/y growth rate peaked at 71.6 percent in March last year, which is in line with the prior two major peaks – 62.6 percent in July 2007 and 80.5 percent in March 2000. On both those occasions, they slightly preceded or coincided with the peak in the S&P 500. This time around, the large cap index could be belatedly catching up, as it peaked this January.
Charts 2 and 3 pose medium- to long-term worries for equity bulls. Both margin debt and foreigners’ purchases – or a lack thereof – take time to turn, with the trend persisting for a while. Until not too long ago, these metrics acted as tailwinds.
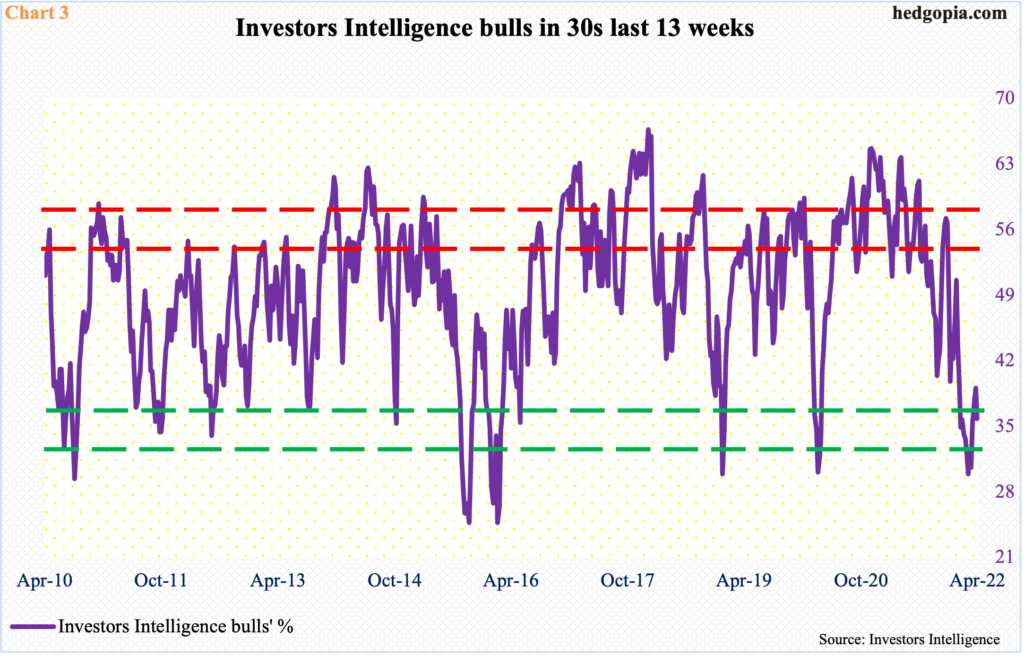
Sentiment, on the other hand, is suppressed enough it has the potential to turn into a tailwind. In the week to last Tuesday, Investors Intelligence bulls were 35.8 percent, down 3.3 percentage points week-over-week. This was the 13th week in a row in which sentiment languished in the 30-percent range or lower, with one week just under 30 percent (Chart 3). This is oversold territory. This gets unwound sooner or later, it is just a matter of time.
The S&P 500 peaked on January 4 at 4819. In the week to that very session, Investors Intelligence bulls were 50.6 percent, before heading south. By February 24, the large cap index tagged 4115, for a drop of 14.6 percent from the high. In the second half last month, it then rallied strongly, ticking 4637 by the 29th. Along the way, bulls managed to take out important resistance, but were unable to cling on to it.
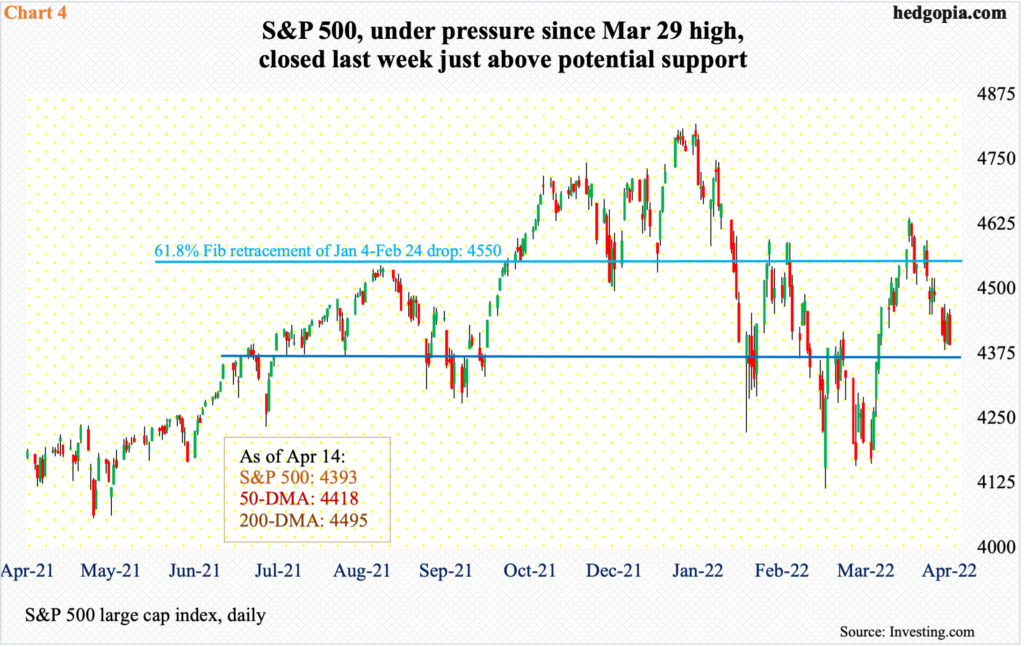
A 61.8-percent Fibonacci retracement of the January 4-February 24 decline lies at 4550, which also approximates with straight-line resistance. Throughout this, sentiment remained suppressed (Chart 3). In the end, bulls ran out of the fuel. Last week, the index closed out at 4393, under both the 50- and 200-day moving averages.
Several weekly indicators are turning back down from the median and could potentially continue lower. At the same time, the daily is oversold, with the S&P 500 just above horizontal support (Chart 4). This is an opportunity for the bulls to put their foot down. Suppressed sentiment could come to their aid.
Thanks for reading!
