
- NYSE margin debt rises slightly in August, hovers near all-time highs
- Since 2009, margin debt has closely tracked expansion/contraction in Fed’s balance sheet
- Margin debt to drop when institutions, badly looking for buyers to sell into, run out of patience and sell
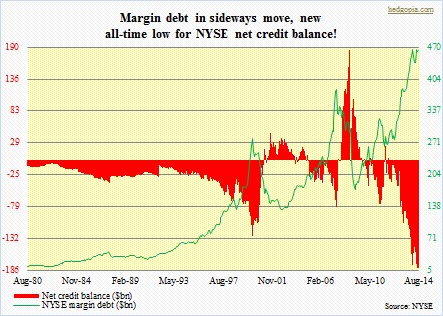 NYSE margin debt rose slightly in August month-over-month, with net credit balance (‘free credit cash accounts’ plus ‘credit balances in margin accounts’ minus ‘margin debt’) at yet another record low. Let us go back in time and look at how margin debt has tended to perform at/near peaks. As can be seen in the accompanying chart, back in 2000 ($278.5bn in March) and 2007 ($381.4bn in July), once margin debt peaked, the descent was as steep as was the ascent. This time around, February this year recorded the all-time high ($465.7bn). It did dip a little in the subsequent couple of months, into April’s $437.2bn, before surging back up. June, July and August each were $460bn-plus. Those who took on leverage are resisting, do not yet want to let go. This is an interesting shift in sentiment versus how things transpired in 2000 and 2007. Going back to our discussion on Monday as to how the Fed’s balance sheet has been tightly correlated with US stocks since 2009 (chart below), the same dynamics seem to be at work regarding margin debt as well.
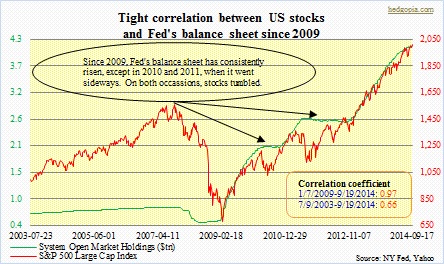 To refresh, the Fed’s balance sheet bottoms in September 2008, then begins to go parabolic, pauses in June 2010 to more or less go sideways, begins to again rise in November 2010, again goes sideways in July 2011, and begins to go parabolic beginning September 2012. Now let us see how margin debt has fared during this time. It bottoms at $173.3bn in February 2009 and surges, peaks in April 2010 at $261.1bn, bottoms in June 2010 at $231.1bn, peaks in May 2011 at $315.4bn, bottoms first in September 2011 at $262.1bn and then at $277.2bn in July 2012, before surging higher. (Please refer to the color codes to see how well they track each other.) Clearly, Fed action is encouraging market participants to take on leverage. ‘Get on the risk curve’ is the new mantra. The question is, now that we know the Fed would be done with its current QE next month, why have we not then seen a contraction in margin debt? To be clear, it has stopped growing, but not contracting, merely going sideways. In 2010 and 2011, as the Fed had told us in advance when its balance sheet would stop expanding, margin debt would stop growing two months prior. But not this time.
Here is a possible explanation. Off the March 2009 lows, the S&P 500 index has tripled. Since June 2012, the index has rallied nearly 60 percent, without a single double-digit correction. So longs are sitting on loads of paper gains. For institutions to lock them in, there need to be buyers on the other side. Reason why so much time is spent on exciting retail money, without much success; retail does not have much money to begin with. For years, we have heard of impending shift of investments from bonds to stocks. Nothing but a pipe dream so far, and should remain that way. So, so long as all the institutions sit on their hands, unwilling to unload, margin debt goes sideways. Once a major institution decides to break faith, others will increasingly come under pressure to lock in profit as well. Sort of a self-fulfilling prophecy! That is when we see a decline in margin debt.
