
Post U.S. tax-cuts, the sell-side pencils in massive earnings for S&P 500 companies for this year and next. Given already lofty valuations, investors are likely to treat this as an anomaly more than a trend.
Earnings estimates for this year and next continue on an upward revision path. Post-passage of tax cuts last December, operating earnings estimates for 2018 and 2019 are aggressively getting revised higher.
Estimates for 2018 bottomed as early as late October last year at $144.07, rising to $145.31 by December 21. The Tax Cuts and Jobs Act of 2017 was signed into law on December 22. Then the revision trend went parabolic. As of last Friday, the sell-side was expecting $156.25 for 2018. Similarly, 2019 went from $160.03 early January to $172.10 (Chart 1).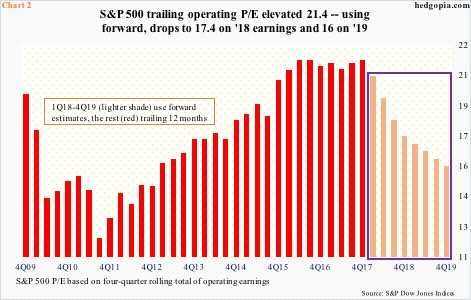
This obviously puts downward pressure on multiples.
With 4Q17 earnings season just about done, S&P 500 companies in 2017 are on track to earn $125.07 out of operations. This puts the trailing price-to-earnings ratio at 21.4. Use forward estimates – which is what the majority uses – this metric improves considerably, with 2018 going to 17.4x and 2019 to 16x (Chart 2). In fact, at the lows of February 9 when the S&P 500 dropped intraday to 2532.69, the index respectively sold for 16.2x and 14.7x.
This is still not cheap, particularly so now that the S&P 500 has rallied nicely off of that low. Arguably, elevated multiples favor the bears’ argument, as much as the sharp rise in estimates for both this year and next favors the bulls’.
Both the bears and bulls can also point to Chart 4 to suit their own biases.
The gap between GAAP (reported) and non-GAAP (operating) earnings began to widen early in the last decade, and has remained that way, give and take. For instance, the difference between the red and green bars in Chart 3 surged in 2008 as companies took “non-recurring” charges left and right. In the following years, the gap shrunk, although it never went away.
As far as the bears are concerned, this amounts to poor quality of earnings. In 2017, the gap widened again, to $18.23. This is expected to drop to $10.58 this year, and rise again to $15.70 in 2019.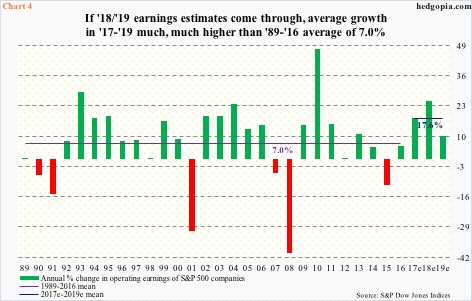
The point in all this is that, yes it is true there has been a substantial improvement in earnings revision trend, but not all the wheels are moving in sync.
The big question is, will investors treat 2018 and 2019 as an anomaly or a trend?
Chart 4 presents annual growth rate in operating earnings going back to 1989. The three bars on the right side simply jump out, with 2017 all but certain to grow 17.7 percent over 2016. Once again, if estimates are met, this will be followed by growth of 24.9 percent in 2018 and 10.1 percent in 2019. These are heady growth rates – an average of 17.6 percent in ’17-’19 – and are much, much higher than what has been historically. From 1989 through 2016, earnings grew at a seven percent annual clip. The ’17-’19 pace is unsustainable.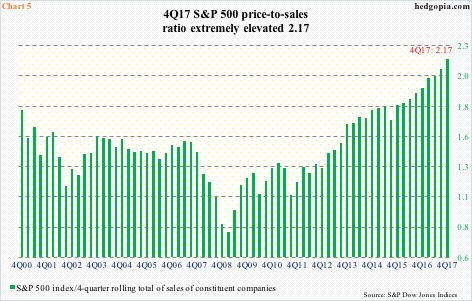
We are witnessing this at a time when another metric – price-to-sales ratio – remains as elevated as it is.
First of all, 4Q17 sales of S&P 500 companies are on pace for 6.4-percent sequential growth. This is very healthy – the best growth rate in five years. Is this sustainable? Here are the facts. Inflation is growing in the two percent range. And U.S. real GDP grew 2.3 percent in 2017, following an increase of 1.5 percent in 2016. So, the short answer is, it is not.
For particularly value investors, this is an important factor to consider, as the S&P 500 already commands a very lofty price-to-sales multiple. In 4Q17, the ratio stood at 2.17 (Chart 5), not that far away from the record high 2.25 in 1Q00.
Put it all together, the odds of investors treating ’18-’19 earnings as an anomaly are very high. Time will tell. Unless, of course, stocks take another leg lower, in which case both Charts 2/5 improve, and that can change the risk-reward dynamics.
Thanks for reading!
