
Nasdaq stocks are attracting some bids. As has been the case for so long, volume continues to remain uninspiring, but price action overrides all. For now. The index has managed to trade north of its 50-day moving average, and has rallied enough in recent sessions that it is now overbought near-term. Bio-techs, which recently suffered such vicious mauling, are a mirror image of action on the Naz. Medium-term, both are approaching the mid-point of several technical indicators. Going by the heavy selling these stocks suffered beginning late February (bio techs) and early March (Nasdaq) and how quickly money headed for the exits, it is possible these indicators begin to turn back down soon. The caveat, of course, being this cycle is unlike any other. The so-called Yellen put is alive and well, and emboldened investors have helped create a floor underneath.
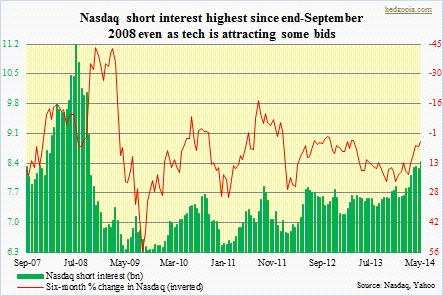 Investor interest in Nasdaq has come at a time when short interest currently stands at highest since end-September 2008. Throughout this year, Naz short interest has progressively risen—from 7.6bn at December–end to 8.4bn mid-May. NYSE (not shown here) has not quite followed the same pattern, but enjoys relatively high short interest – 14.2bn mid-May, versus 13.4bn at December-end and off the mid-March high of 14.7bn. Short interest can be a tricky animal to analyze. A high level can be viewed as bullish should there be a catalyst for a squeeze. Once a squeeze is set in motion, it becomes a self-fulfilling prophecy. On the other hand, presence of high short interest alone is not reason enough for a squeeze. In order for that to unfold, a change is needed – be it in fundamentals with respect to the underlying, or in investor perception, or simply because sellers are done selling. A lack thereof can give shorts more conviction behind their bearish bias. This is how things evolved in 2008. When the index peaked in October 2007, Naz short interest already stood at 8bn. The index then came under pressure, and shorts kept pressing; short interest eventually peaked at 11.2bn by mid-July 2008.
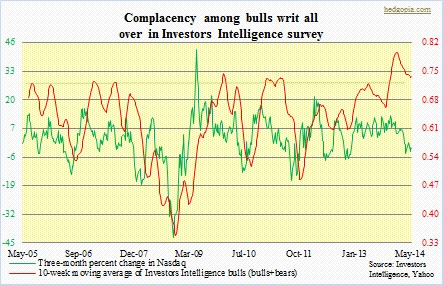 In the present circumstances, the Naz is at a crucial juncture. As mentioned before, several medium-term technical indicators have managed to rise from oversold conditions and are approaching their mid-point. Bulls have an opportunity to cash in on the current momentum so the oversold conditions are completely unwound. If they succeed, there is potential for a squeeze. In the same vein, there is another scenario we can think of. If short interest follows the 2008 pattern, then it can continue to inch up. As the chart on top shows, buildup of short interest tends to put downward pressure on the index. At least by one metric, this scenario is not completely out of the question. Investor complacency is very high. Going back at least nine years, equities have shown a tendency to sell off once the 10-week moving average of Investors Intelligence’s bulls/(bulls+bears) reaches 0.70 or above. That metric has been in the 0.70s since mid-November last year, and has been as high a 0.80. Barring three weeks in February, bulls’ percent has been in the ‘50s since end-October last year. This is an extraordinary level of bullishness and leaves room wide open for a massive reversal, timing notwithstanding.
