
Mid-January, Nasdaq short interest rose to a four-plus-year high. In 14 months, the index rallied north of 52 percent. Shorts find this, among others, a compelling reason to build positions. Ironically, they may also end up helping longs defend support zones.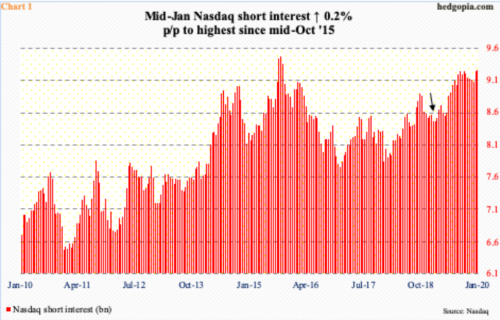
In the mid-January period, Nasdaq short interest rose 0.3 percent period-over-period to 9.26 billion shares. In the prior period, it was up 1.7 percent. With this, short interest is now the highest since mid-October 2015 (Chart 1).
On a related note, mid-January short interest on QQQ (Invesco QQQ Trust) jumped 8.7 percent p/p to 58.7 million shares – an eight-month high (not shown here).
Shorts increasingly have an itchy finger as stocks in general and the Nasdaq in particular relentlessly push higher.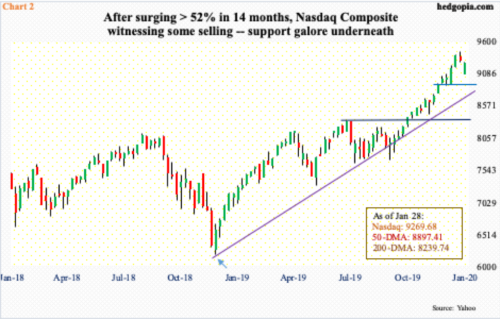
The Nasdaq Composite hammered out a major bottom in late December 2018 (arrow in Chart 2). Shortly afterwards, shorts began to get active. At the end of January last year, short interest was 8.46 billion (arrow in Chart 1). Since peaking at the end of September 2015 at 9.48 billion, short interest bottomed mid-January 2017 at 7.77 billion, followed by a higher low of 7.84 billion at the end of that year.
It is easy to see why shorts are getting tempted to add or initiate new positions. Since the December 2018 low through last Friday’s all-time high of 9451.43, the Nasdaq (9269.68) rallied north of 52 percent. That is in 14 months! At some point, the upward momentum will break. When that happens, it is possible overzealous shorts – at least at the beginning – will end up lending a helping hand to the bulls.
After last Friday’s bearish engulfing candle, the Nasdaq started the week down, with an intraday low Monday of 9088.04. Tuesday’s 1.4-percent rally places the index right between the 10- and 20-day moving averages. This is where a bull-bear duel is likely to take place near term.
The advantage bulls have is that on their way to record highs, several resistance zones got taken care of, which will now serve as support. This is where shorts can be tempted to cover. The nearest such level lies at 8930s, which also approximates the 50-day at 8897. The daily lower Bollinger band at 8923 lies around there. Just below rests trend-line support from the December 2018 trough. If a breach occurs, then 8330s become relevant. Shorts likely are closing watching these levels.
Thanks for reading!
