
US corporate profits are now down four quarters in a row from the record 2Q22, even as the sell-side has S&P 500 non-GAAP earnings growing 11.7 percent this year and 11.5 percent next. The gap between GAAP and non-GAAP in this regard is telling.
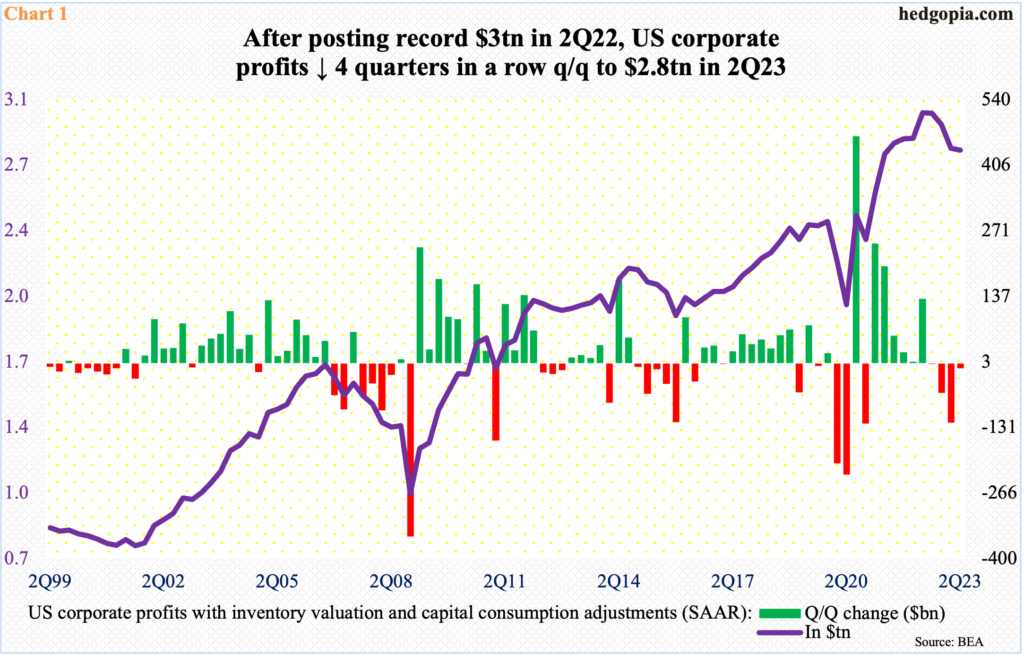
US corporate profits with inventory valuation and capital consumption adjustments dropped $10.6 billion in the June quarter to a seasonally adjusted annual rate of $2.81 trillion. This was the fourth quarter in a row of quarter-over-quarter contraction since profits hit a record $3 trillion in 2Q22. During that time, profits shrank by a cumulative $193.8 billion (Chart 1). This has been the longest slump in profits since a five-quarter contraction in succession in 2014-2015.
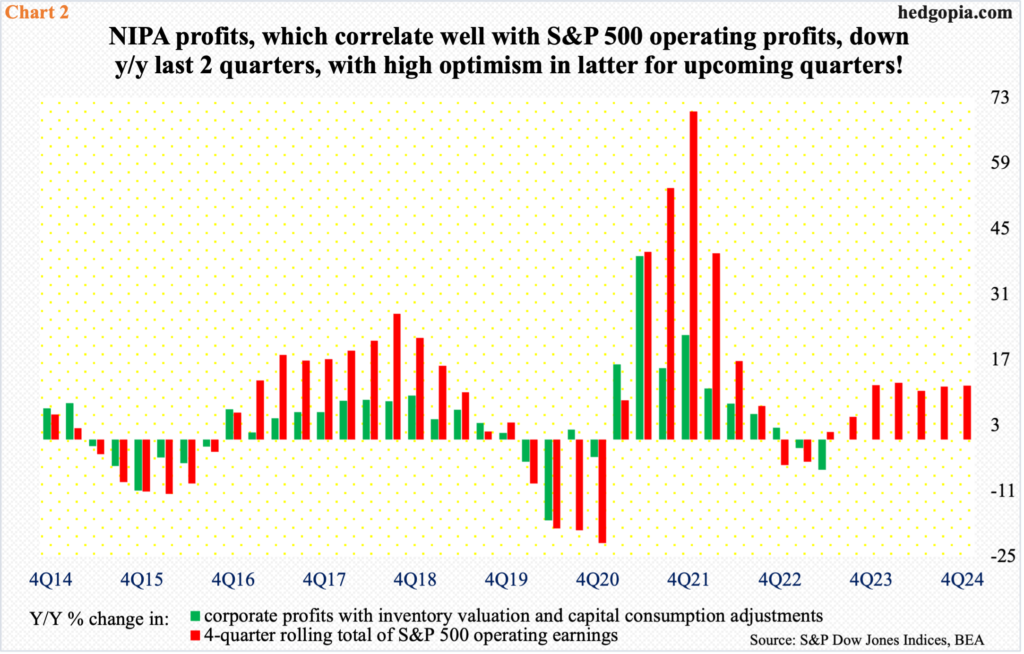
On a year-over-year basis, corporate profits dropped in the first two quarters this year – down 1.8 percent and 6.5 percent, in that order. Corporate profits maintain a tight correlation with S&P 500 operating earnings. Typically, non-GAAP S&P 500 profits outgrow NIPA (national income and product accounts) profits – both during up and down cycles.
With the 2Q earnings season just about over, the four-quarter rolling total of S&P 500 operating earnings is tracking up 1.6 percent; before that in 4Q22 and 1Q23, earnings respectively fell 5.4 percent and 4.8 percent. More interesting is how the red bars in Chart 2 are expected to improve meaningfully in the out quarters. After three quarters of year-over-year declines, quarterly earnings began to grow in 1Q23, and the positive momentum is expected to continue all through at least 4Q22.
As things stand (as of Tuesday last week), the sell-side expects $245.19 in S&P 500 operating earnings next year, up from the blended $219.91 this year. If this optimism materializes, non-GAAP earnings would have grown 11.7 percent this year and 11.5 percent next year.
However, interest rates have gone up sharply in the last year and a half, and its impact in all probability has not all filtered through to the economy.
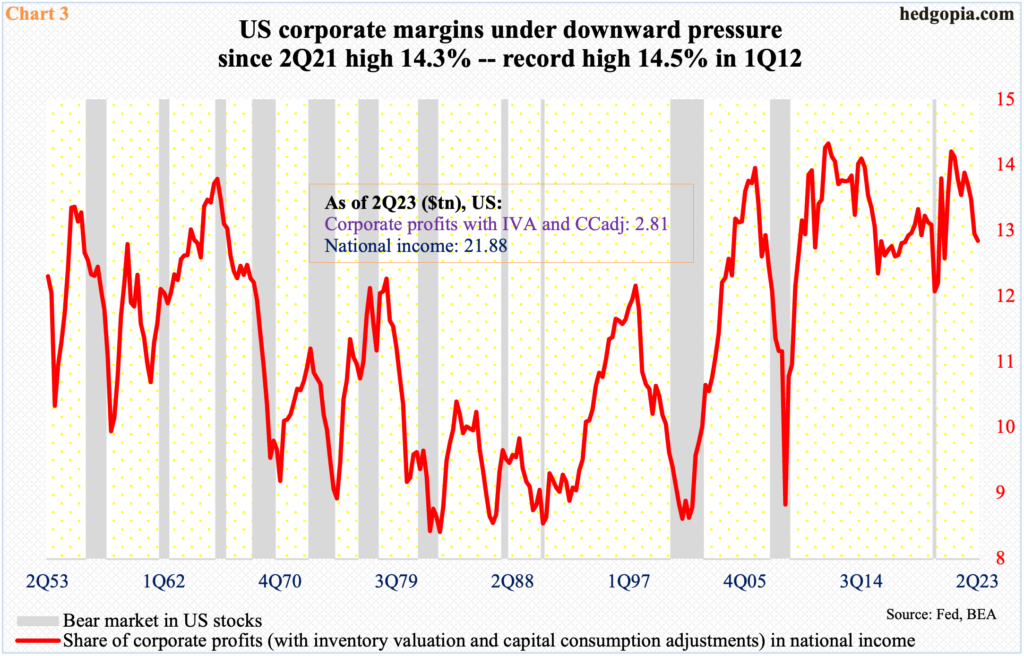
In the unlikely event that 2024 growth forecast comes through, it has the potential to put upward pressure on corporate margins, which have been under downward pressure since touching 14.3 percent in 2Q21 – not that far away from the 1Q12 record high 14.5 percent (Chart 3).
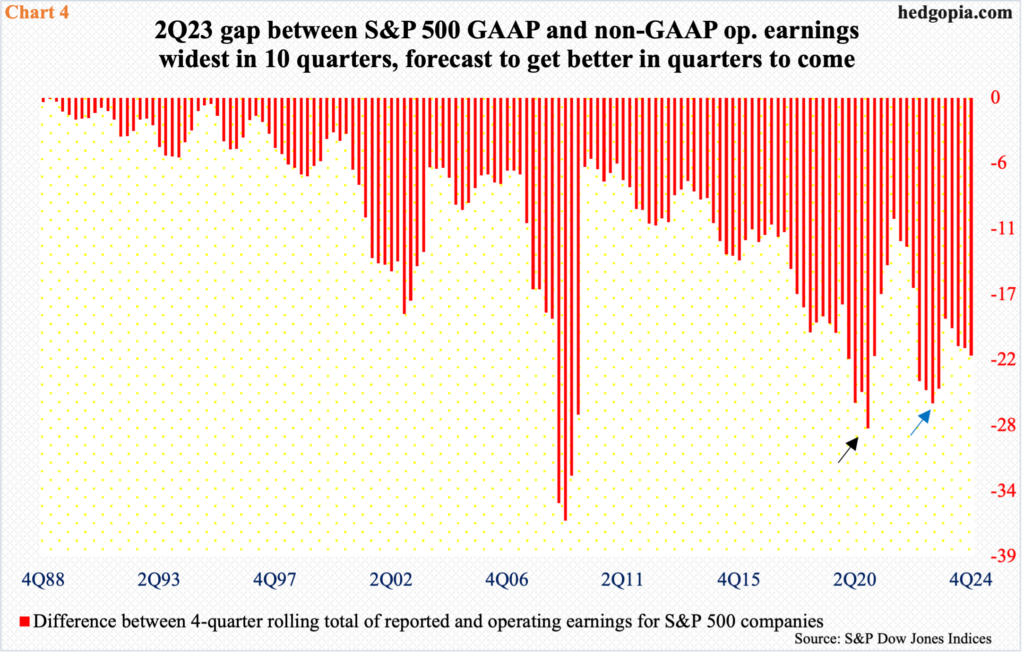
The gap between GAAP and non-GAAP S&P 500 earnings is telling in this regard. Over the years, the gap has gotten more and more noticeable. Both measures are important in their own right. It is possible non-GAAP tends to overstate earnings, while GAAP does the opposite. On balance, the lesser the discrepancy between the two the higher the quality of earnings.
In 2Q23, the gap between GAAP (reported) and non-GAAP (operating) in four-quarter rolling total was minus $26.10 – $182.17 versus $208.27 (blue arrow in Chart 4). This was a 10-quarter high. The prior high of $28.24 posted in 4Q20 was the highest since 2Q09 (black arrow).
During recessions, GAAP earnings collapse as companies take asset write-downs, etc. This year, the economy is chugging along, with growth of 2.1 percent in the June quarter, preceded by two percent increase in the March quarter. Yet, the 2Q23 gap between GAAP and non-GAAP is very high, raising questions about the quality of earnings. NIPA profits are not in agreement with this anyway.
Amidst this, the gap is expected to bottom in 4Q this year and then gradually rise next year, which makes it even more difficult to make a head or tail of consensus estimates. Right here and now, NIPA profits are probably sending the right signal.
Thanks for reading!
