
The January barometer failed to work last year. This year, if the first session is anything to go by, odds are it will be volatile. Amidst all this, equity bulls should take heart from the fact that in the latest week Investors Intelligence bears finally overtook bulls. Sentiment is beginning to look panicky.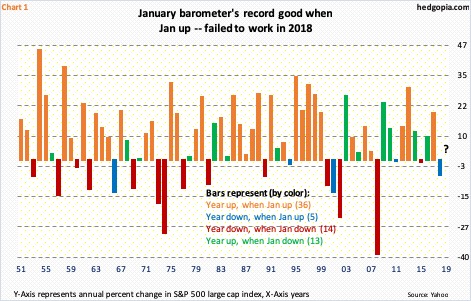
It is that time of the year again. January is here, and we will be hearing a lot about the so-called January barometer, which posits that how January fares sets the tone for the year. The phenomenon does have a fairly good track record.
Chart 1 looks at the S&P 500 annual returns going all the way back to 1951, with an apparent question mark for 2019.
The data is divided into four buckets: (1) years that were up when January was up, (2) years that were down when January was up, (3) years that were down when January was down, (4) years that were up when January was down. In parenthesis is the number of years for each bucket.
Of the 68 years covered, the January barometer came to pass in 50. Pretty impressive! Orange bars simply jump out. They represent the years in which the S&P 500 was up for the year after a positive January. The red ones correspond to the ones in which both January and the year ended in the red.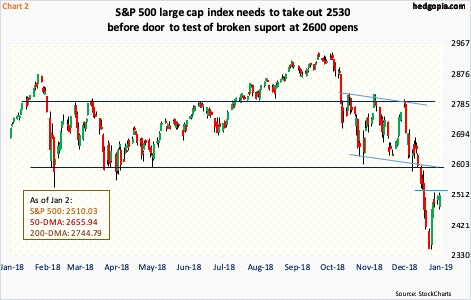
In this respect, 2018 was an anomaly. January was up 5.6 percent, but the year ended down 6.2 percent. Since 1951, this has occurred four other times (blue bars).
The year 2019 has gotten off to an interesting start. On Wednesday, in overnight futures, the S&P 500 was down big. In the regular hours, the index opened down and was down as much as 1.6 percent intraday but crawled its way back to end the session up 0.1 percent.
The advantage bulls have for January at least is the oversold condition US stocks are in. From the all-time high of 2940.91 on September 21 last year through the low on December 26, the S&P 500 (2510.03) lost 20.2 percent. It is up seven percent from that low. There is room for more should bulls begin to get their act together. On the way down in October-December, one after another support gave way. Mid-December, 2600 was lost. In the right circumstances, this can act as a magnet near term. For that, bulls first need to get past 2530 (Chart 2).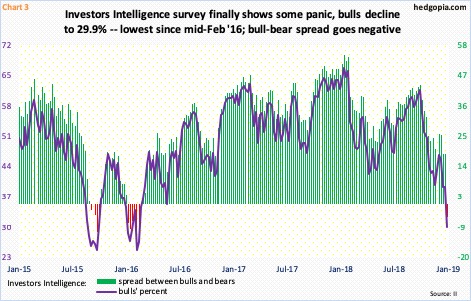
Bulls must be heartened by this week’s Investors Intelligence data. During the three-month rout, several metrics dropped into oversold territory, some near panicky levels. On December 24, merely 1.2 percent of S&P 500 stocks were above the 50-day moving average – the lowest since August 2011. Investors Intelligence bulls, however, were still holding their ground. Not anymore.
This week, bulls fell to 29.9 percent, which is the lowest since mid-February 2016. Bears jumped to 34.6 percent – the highest since early March 2016. The bull-bear spread went negative, which once again is the first occurrence since February 2016 (Chart 3).
Going by at least how things evolved in early 2016, it is entirely possible sentiment numbers go sideways before unwinding. In this scenario, stocks go sideways at best and down at worst. So (1) January is still a toss-up, even though the path of least resistance is an up month, and (2) even if it is a positive month, 2019 could very well get drowned in economic crosscurrents and end up like last year.
Thanks for reading!
