
Last week when October’s jobs report was published, there was one particular data point that really jumped out. The average hourly earnings of private-sector employees jumped 2.5 percent year-over-year, to $25.20 (Chart 1). This was the fastest rate employee earnings had grown since 2.6 percent in July 2009.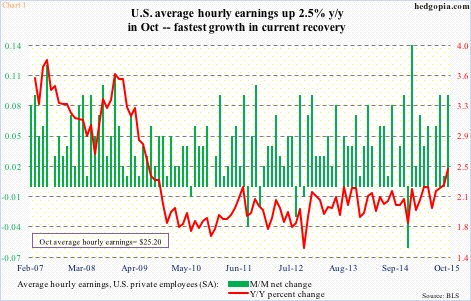
The October spike came in the midst of an unemployment rate that dipped to five percent. At some level, the labor market looks tight – and is getting tighter. But then again, 94.5 million Americans have left the labor force, up from 80.9 million when Great Recession ended. This probably explains why wages have been stuck in a rut.
Nowhere is this phenomenon more evident than in Chart 2. In past cycles, National Federation of Independent Business members’ compensation plans – which are advanced by nine months in the chart – have tended to lead the annual change in average hourly earnings of production and non-supervisory employees. Historically, there is a tight relationship between the two, but it broke down more than a year ago. That said, the green bars have been trending higher since early this year, with a noticeable spike in October.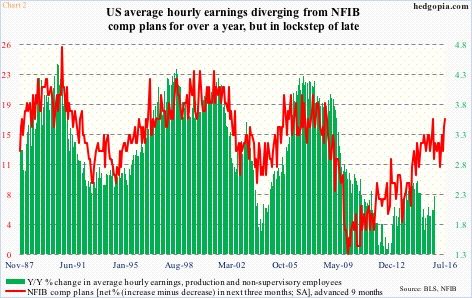
Hence the question, are the two variables in Chart 2 reestablishing the correlation? If so, more good news awaits U.S. employees as far as wages are concerned. Why? NFIB comp plans have been trending higher since June, rising to 17 in October.
In this scenario, it is possible the spike in the red line in Chart 1 and the green line in Chart 2 is a sign of things to come – portending good times ahead.
Before we start popping champagne and high-fiving, here are a couple of thoughts in this regard.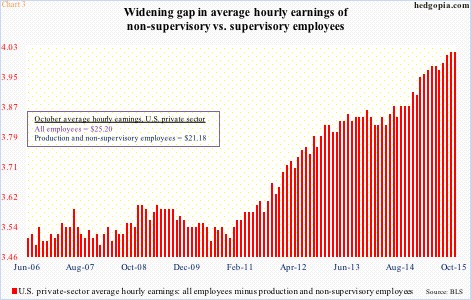
First of all, Chart 1 looks good on the surface, but a deeper look reveals an underlying problem – the gap is widening between earnings of those who supervise and those who are under supervision. The red line in Chart 3 has persistently risen for over five years now. In October, it stood at $4.02, unchanged from September. The upward push in the green line in Chart 1 is coming primarily from growth in earnings of supervisory employees.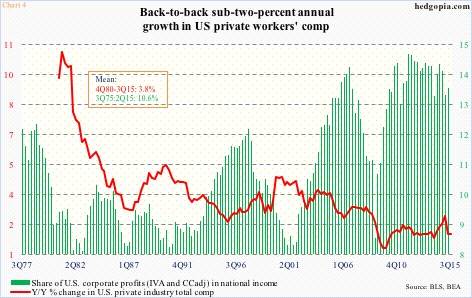
Secondly, the employment cost index is so far not confirming the October spike in average hourly earnings. In the third quarter, total comp (both wages & salaries, and benefits) of private-sector employees grew 1.9 percent annually, unchanged sequentially and the lowest since 1Q14 (Chart 4). The green bars in the chart highlight the increasing share of corporate profits in national income in the current cycle. Labor increasingly gets the short end of the stick.
Is this about to change? If it is, and if October is not just an aberration, it will begin to show up in the ECI data. Chart 4 is as of 3Q15. The spike in earnings in Chart 1 took place in October. If momentum is building, it should begin to show up in 4Q15 numbers.
Thanks for reading!
