
Thanks to faster growth in the second half last year, inventory is getting wrung out of the system. It is probably only a matter of time accumulation occurs again.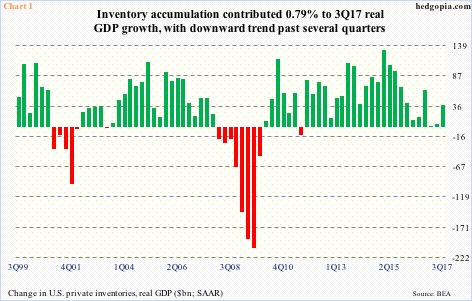
In 3Q17, U.S. real GDP grew at an annual rate of 3.2 percent, 0.79 percent of which was contributed by inventory accumulation.
Change in private inventory investment totaled $38.5 billion last quarter, versus $5.5 billion in 2Q17 (Chart 1). The green bar in 3Q17 was the tallest in three quarters, but the overall trend has been down for a while.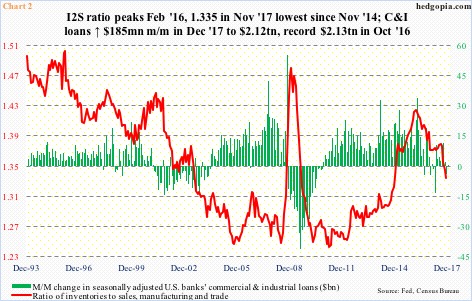
Ditto with manufacturing and trade inventories.
In November, seasonally-adjusted inventories reached a new high of $1.90 trillion, and sales $1.42 trillion – also a new high. But the pace of growth has been much faster in sales than in inventories.
Chart 2 shows a ratio between the two. The red line peaked in February 2016 at 1.424, before coming under sustained pressure. In November last year, it stood at 1.335. Between those two dates, sales increased 12.4 percent and inventories 5.3 percent.
This has impacted banks’ commercial & industrial loan growth. In December, they inched up $185 million to $2.12 trillion.
C&I loans have remained north of $2 trillion since March 2016, but growth has decelerated. They peaked at $2.13 trillion last October.
The deceleration likely continues as long as the red line continues lower. Even in this scenario, if the growth delta between sales and inventories continues, at some point investment in the latter should accelerate.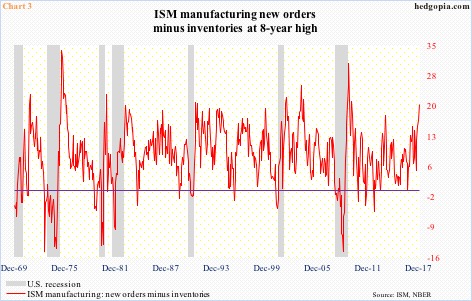
The rather suppressed level of manufacturing inventories is also evident in the ISM survey.
In December, the inventories index rose 1.5 points month-over-month to 48.5, but was seven points higher in August (2017).
Moreover, new orders have been accelerating, surging 5.4 points m/m to 69.4 in December. This was the highest since 70.6 in January 2004.
Chart 3 simply subtracts ISM inventories from orders, and the mismatch could not be starker. December was at an eight-year high.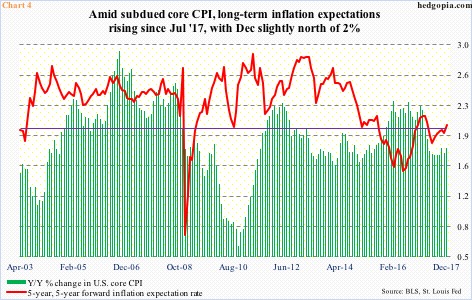
If the momentum in orders continues, this only points to the need for inventory accumulation at some point in the future.
In this context, what transpires on the inflation front is yet another variable that can potentially impact the inventory equation.
Of late, there is much talk about inflation on the verge of picking up. On the consumer level, core CPI remains suppressed. It rose 1.78 percent in the 12 months to December. This was the ninth consecutive month of sub-two-percent reading. That said, it has been creeping higher since 1.68 percent last August.
Further, inflation expectations have risen faster in recent months.
In Chart 4, the red line represents the five-year, five-year forward inflation expectation rate, which is a measure of the expected inflation over the five-year period that begins five years from today. In December, it jumped nine basis points m/m to 2.04 percent – first time in eight months it crossed over two percent. If this metric is indeed forecasting incipient inflation in the system, it can potentially impact inventories down the line.
During deflation, it pays to put off purchases. It is the opposite during inflationary periods. As time passes, things get expensive, so it helps to build inventories. The downside to this is that more often than not this is what can kill a business cycle. Sales/orders begin to lag, even as inventories get to excessive levels, thereby setting in motion a digestion process.
Thanks for reading!
