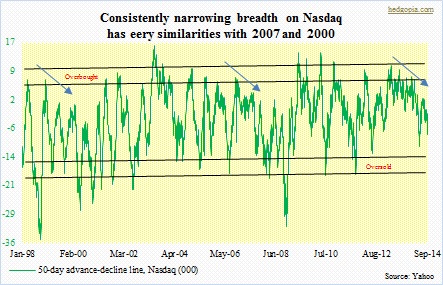
 The past couple of days, there has been much talk about deteriorating breadth on the Nasdaq Composite. The index consists of over 2500 stocks, with a combined market cap of nearly $9tn. It turns out nearly half are down in excess of 20 percent from their 52-week highs. Whoa! Kudos to Bloomberg who first brought the issue into focus. Then others have picked up. For a while on this blog, narrow breadth particularly among Nasdaq stocks has been a topic of discussion. Year-to-date, the index is up nine percent, even as several large constituents are up substantially more – AAPL up 29 percent, MSFT 27 percent, INTC 38 percent, CSCO 15 percent, FB 40 percent, TXN 12 percent, among others. This is what is driving the index. Unlike the Dow Industrials, which is price-weighted (stocks with higher price are given more weight), the Nasdaq, as is the S&P 500 Large Cap Index, is cap-weighted (larger companies wield more weight). For the index to rally, it does not matter how many participate, rather how many big-caps throw their weight around. And the latter group has done exactly that. To get some perspective, back in 2000 and 2007 we had a similar situation. As can be seen in the chart, the A-D line was consistently making lower highs leading up to March 2000 and October 2007. When it was all said and done, that saga did not end very well. In hindsight, all along the shift to large-caps was defensive in nature. Market participants were hiding in these “safe” names. In due course, gravity went to work, and the narrowing group of leaders fell under their own weight. Will history repeat itself? Timing notwithstanding, the longer this goes on, the higher the odds.

