
NYSE margin debt only increased $3.3bn in November. The S&P 500 rose 2.5 percent in the month. Except for brief ups and downs toward the middle of 2014, margin debt has essentially gone sideways for the first 11 months last year. Net credit balance (free credit cash plus credit balances in margin accounts less margin debt) continues to hover near all-time lows. So it is increasingly getting harder to tap into this source for additional funds.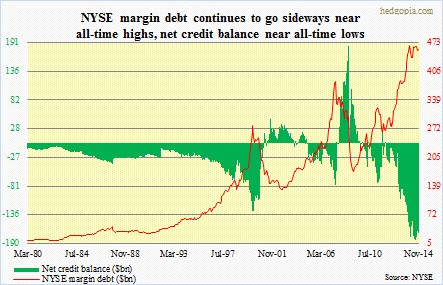
And it is evident in the chart below.
The chart shows how the S&P 500 progressed in 500-point increments since the March 2009 bottom versus sources of funds from three major sources: U.S. money market funds, net foreign purchases of U.S. equities, and NYSE margin debt.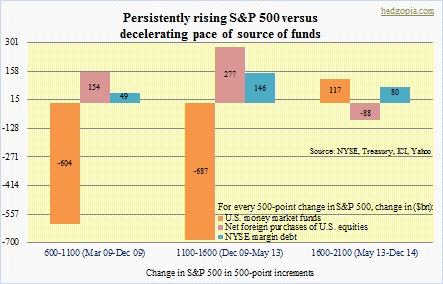
For the first 500-point rise (from 600-1100 during March 2009-December 2009), margin debt rose $49bn, foreign purchases $154bn, even as money market funds decreased by a whopping $604bn. All three were positive developments for equities.
For the second 500-point increment, all three picked up the pace.
For the third 500-point increment, things are different. Two of the three were no longer sources of funds. Margin debt still went up, but by a mere $80bn. Net foreign purchases were down $88bn (as of November). And money-market funds increased by $117bn. The foreign purchases data is as of October, so it could look different when we get the latest data.
Last week, we did learn about $39bn in flows into U.S. stocks in the week ended December 24.
But the overall trend in all three sources is not very encouraging. Needs to get better if stocks are to repeat last year’s performance.

hedgopia
Thanks for comments!
It is a well-known fact that corporate buybacks have provided a big tailwind to U.S. stocks. By October last year, S&P 500 companies were on track to spending $914bn — $565bn in buybacks and $349bn in dividends — in 2014 (courtesy of S&P). Here is the kicker! This would make up nearly 95 percent of the expected $964bn in profits. Is it sustainable long-term? No.
When it is all said and done, sources of funds like the ones discussed in the blog post matter. Now it is equally possible that the recent trend reverses itself and the three sources begin to once again be a tailwind rather than a headwind. In other words, money-market funds shrink, and the other two rise. But absent that, the trend is not encouraging. That is what the post is trying to drive at.
dick1931
Should add: Possible explanation for continued rising market.
dick1931
Possible explanation: The total supply of domestic stocks is shrinking due to buy backs, private equity and mergers per a chart I saw a while back. From my memory it looked like a 25-30% reduction.
It would be very interesting to see this chart again if you can put it together.
Thanks