
Dividends are an important source of income for U.S. households.
In 4Q15, they came in at a seasonally adjusted annual rate of $877.1 billion. On a four-quarter rolling average basis, personal dividend income was $868.2 billion in that quarter – an all-time high. In the prior cycle, it peaked at $839.6 billion in 2Q08 (Chart 1).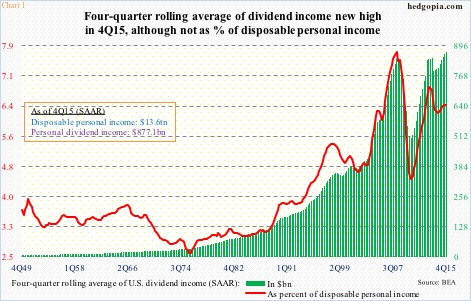
That said, when measured as a percent of personal disposable income, the four-quarter rolling average falls far short of the 7.74 percent peak in 1Q08. In 4Q15, the red line in Chart 1 was 6.39 percent.
In 4Q15, personal disposable income reached a record $13.6 trillion, up from $11 trillion in 2Q09. Arguably, dividend income could be doing better.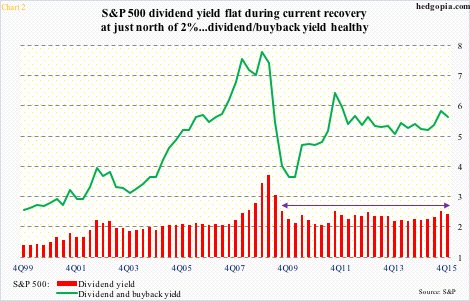
There is a similar message in Chart 2. The red bars represent the dividend yield on the S&P 500. In the current recovery, it has pretty much gone flat. In 4Q15, the index was yielding 2.14 percent.
On a four-quarter rolling total basis, S&P 500 dividends were $43.39 in 4Q15 – an all-time high. Operating earnings, however, peaked at $114.51 in 3Q14, with $100.45 in 4Q15. Why might this be important?
Chart 3 is the answer. The red line is decidedly down, even as the green bars continue higher. They do tend to move together.
Here is the thing. In 4Q15, on a four-quarter rolling total basis, dividends made up 43.2 percent of operating earnings – the highest since 3Q09. Dividend payment is holding up, while earnings are seriously decelerating.
That said, the current payout ratio is not that out of whack on its own. It is, when we introduce buybacks to the equation.
In the current recovery, buybacks have gone through the roof. On a four-quarter rolling total basis, they were $572 billion in 4Q15 – second only to 4Q07 ($589 billion) and 1Q08 ($585 billion).
For the past seven quarters, the rate of change in the green bars in Chart 4 has been in deceleration, but has continued to inch higher.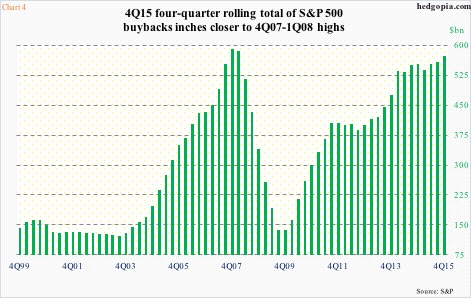
As a result, buybacks and dividends combined has now been extended into dangerous territory. In three of the past four quarters, the two made up more than 100 percent of operating earnings. In 4Q15, the two added to $245.27, even as operating earnings were $201.86.
In the past, buybacks did not account for this big a portion of S&P 500 operating earnings. In theory, cash that is currently being spent on buybacks could be doled out in dividends, retained, used in debt reduction, in merger & acquisition, and what not.
Indeed, the green line in Chart 2 calculates a yield using both dividends and buybacks. Combined, the S&P 500 was yielding 5.33 percent in 4Q15 – 2.14 percent and 3.2 percent, respectively.
This tells us a few things.
One, if not for buybacks, the dividend yield on the S&P 500 would probably be higher, as companies could potentially use that money in boosting dividends.
Two, the current trend of paying more in dividends and buybacks than is being earned out of operations is unsustainable.
Three, it is just a matter of time before either buybacks or dividends or both are cut. The former in particular has been one of the most reliable sources of buying power for stocks, hence would obviously be a negative when cut. And the latter is never a positive, especially when the yield is already low.
For lack of earnings acceleration, one way the dividend yield gets a boost is through compression in the denominator, that is stocks. A reduction in buybacks would make sure this happens.
Thanks for reading!
