
QQQ, the PowerShares Nasdaq 100 ETF, is showing signs of fatigue.
Off the February 11th low through last Friday’s intra-day high, the ETF rallied nearly 10 percent in 11 sessions (Chart 1). Yes, this preceded a 17-percent drop since December 29th high. Nonetheless, the latest rally arguably has come too far, too fast.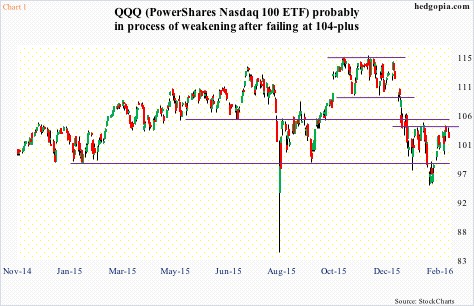
Digestion is normal at this juncture, especially considering daily technicals are overbought.
Not surprisingly, sellers have come out of the woodwork right at resistance.
Last Friday’s high ($104.37) was within a hair’s breadth away from the 50-day moving average ($104.62 at the time, and $104.43 by Monday close). It was a first test of that average since December 31st, so it was normal for the price to retract at the first try. Plus, this level also approximates six-week horizontal resistance.
QQQ’s top five holdings are: Apple [(AAPL), 11.4 percent]; Alphabet [(GOOGL); Alphabet Class C five percent and Class A 4.3 percent]; Microsoft [(MSFT), 8.5 percent]; Amazon [(AMZN), 5.8 percent], and FB [(Facebook), 4.5 percent].
On a daily chart, each of the five look ready to go lower – AAPL, AMZN, and MSFT in particular.
The question is, would this mark at least a short-term top for QQQ?
It is possible – depending on how volatility behaves and how non-commercials position themselves in the futures market.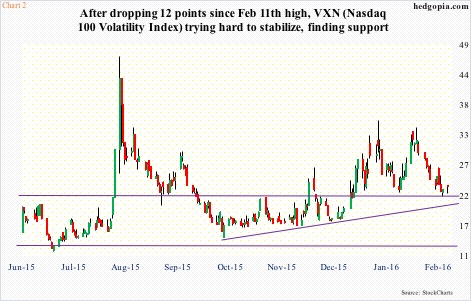
Since the middle of January, VXN, the Nasdaq 100 Volatility Index, traded north of 30 in 10 different sessions, with two distinct spikes followed by reversals. Off the February 11th high through last Friday’s low, it gave back north of 12 points.
That said, last Friday, support at 22-ish was defended (Chart 2). Yesterday, intra-day weakness was once again bought right on that support, in the end resulting in a hammer. For QQQ to come under pressure, VXN needs to stabilize, and signs are emerging that it is attempting to do just that.
The slightly rising 200-day moving average lies at 20.50, which also approximates a rising October 2015 trend line (Chart 2). In the next few sessions, this support rises to meet with the afore-mentioned support… hence likely gets defended.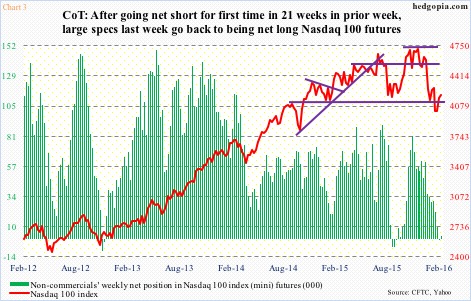
Secondly, for the first time in five months, non-commercials the week before went net short Nasdaq 100 index (mini) futures (Chart 3). Last week, they went slightly net long. Back in September last year, they stayed net short for a couple of weeks, before switching back into net long, and that was a major tailwind for the index. Will history repeat itself? Remains to be seen.
One thing the recent rally in QQQ has not succeeded in achieving is attract new money. Last week, $267 million was redeemed (courtesy of ETF.com), even though the ETF rallied 1.8 percent. Longs are leaving, taking advantage of the rally.
For lack of funds, the afore-mentioned resistance probably holds. By the way, even if $104-plus is conquered, QQQ ($102.50) faces bigger resistance at $105.50 (Chart 1).
Risk/reward probably favors the bears right now.
Hypothetically, March 11th weekly 103 calls bring $1.41. This is a slightly-out-of-the-money naked call, hence risky. A call spread would be safer, but there is not much premium. If called away, it is a short at $104.41 – right around the afore-mentioned resistance.
Thanks for reading!
