- Solid improvement in U.S. home prices comes with cost
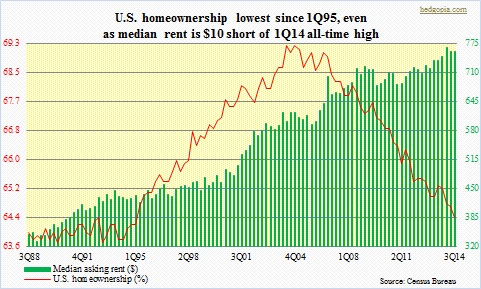
- Peak bubble home ownership at 69-percent-plus anomaly not average
- Price weakness in recent months plus mortgage-rate tailwind unable to seriously ignite sales
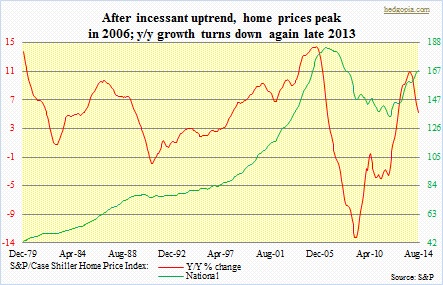 Leading up to the epic housing bubble in the U.S. in the middle of the last decade, we were consistently told why it was so rare for home prices to drop on an annual basis. Indeed, as the adjacent chart shows, the S&P/Case Shiller National Home Price Index had a relentless from-lower-left-to-upper-right advance. Except for a few bumps here and there, home prices at least kept up with consumer inflation. Hence the near-universal belief that the price could only go one direction – upward. Until the middle of 2006 when the momentum began to reverse. And reverse it did. The median price of a new home peaked in 2007 at $247.9k. It fell in excess of six percent in 2008 and another six-plus percent in 2009, before rebounding. And rebound it has. The monthly price peaked at $287k in June this year – an all-time high. The S&P/Case Shiller index is off its mid-2006 highs, but substantially above early-2012 lows. The point is, there has been quite an improvement in the price. This comes with hidden cost.
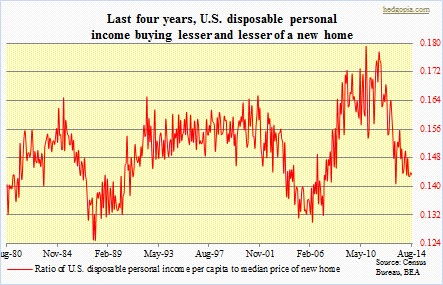 In an environment in which wages are barely keeping up with inflation and job creation mediocre, rapid price appreciation is suicidal, to say the least. Price is one of the important variables that go toward determining affordability. Going by sales activity, affordability is getting costly. The accompanying chart shows disposable personal income per capita currently buys 14 percent of a new home, down from 18 percent four years ago. Post-bubble burst, existing-home sales peaked in July 2013 at 5.38mn seasonally adjusted annual rates; September came in at 5.17mn units. Sales of new homes were at a new post-bubble high of 467k (SAAR) in September; nevertheless, after 459k in June 2013 sales have been bobbing up and down in a range. The chart below clearly shows a waning momentum in sales of new homes. In it, the 30-year fixed mortgage rate is subtracted from change in price of a new home, and the difference is plotted against year-over-year change in 12-month running total of sales. The idea is simple. Buyers are incented to purchase so long as price appreciation exceeds the cost of capital. The variables track each other well. September saw a slight uptick in the red line, otherwise momentum has been downward. This in the midst of a mortgage rate that clearly should have been a tailwind – 4.16 percent in September versus 4.49 percent a year ago.
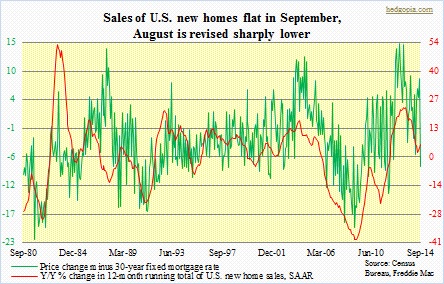
Price can both be a deterrent as well as a stimulant. Since the June peak, the price of a new home has declined a little less than 10 percent (to $259k), and of an existing home by less than six percent (to $209.7k). Is this enough of a drop to nudge sales higher? Too soon to say. What we do know is this. Signals continue to come in mixed on prospects of wage gains. And then there is the question of can rates go any lower? Persistent drop in mortgage rates set off a boom in refinancing, which has now petered out. On October 15th, yields on the 10-year dropped all the way to 1.87 percent before climbing right back up. It is hard to imagine the 10-year sustain below the two handle without the economy simply falling apart. In due course, the base case on this blog is that it is headed below two percent. That will be the price to pay in the future for the excessive central-bank activism now. But probably not in the immediate future. Means lesser odds of sales push from lower rates. Nonetheless, that is not the message coming out of the National Association of Home Builders. They continue to exude confidence, and in all probability will have to adjust their expectations down.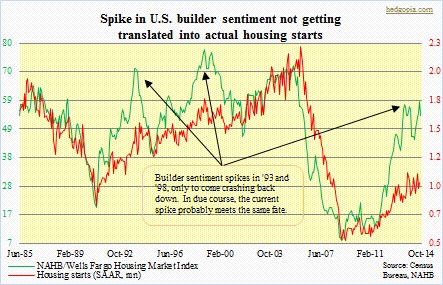
The good thing is, they are not putting their money where their mouth is. Housing starts, in the one-million range, have doubled from 2009 lows but not crazy. Importantly, at least going by past cycles, as builder sentiment comes under pressure, starts follow. This should especially be the case as/if sales weaken. Recent trends in pending home sales are not very encouraging. They have pretty much gone sideways since July. As pointed out earlier, since June, prices of both existing and new homes have dropped by a decent amount. As well, the 30-year fixed mortgage rate is flat the past three months but down 30 basis points this year. If there was massive pent-up demand as housing bulls would like us to believe, this would be the time for potential buyers to step in. This is particularly the case given how low the homeownership rate has gotten. The 3Q14 reading of 64.4 is the lowest since 1Q95. Low home ownership is widely cited as potential sales tailwind. The thinking being the current weakness is that it is an anomaly and will be corrected in due course.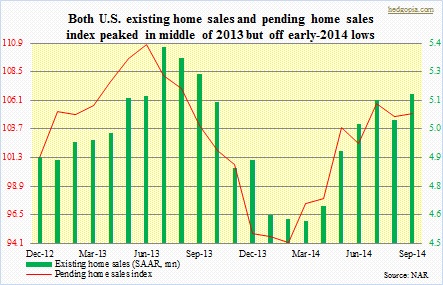
Here is an alternative thinking. The homeownership rate has done a complete round-trip – began to rise in 1995, peaked in 2004 and is now back at pre-spike levels. This was also a time when U.S. household mortgage balances grew from just north of $3tn to a peak of just below $11tn in 2008. The S&P/Case Shiller index began to take on a parabolic shape in 1997. Years leading up to the bubble peak in particular were defined by lax underwriting standards and a Fed that mistakenly was desperate for an antidote to the adverse effects of the 1999/2000 tech bubble. These were not normal times. It follows that the envious growth rate the nation put up in home ownership was anything but organic. Things may just be beginning to settle at a sustainable level.