
Record buybacks are acting as a big tailwind, offsetting headwinds coming from foreigners and margin debt. Investor sentiment is suppressed enough it can act as a tailwind.
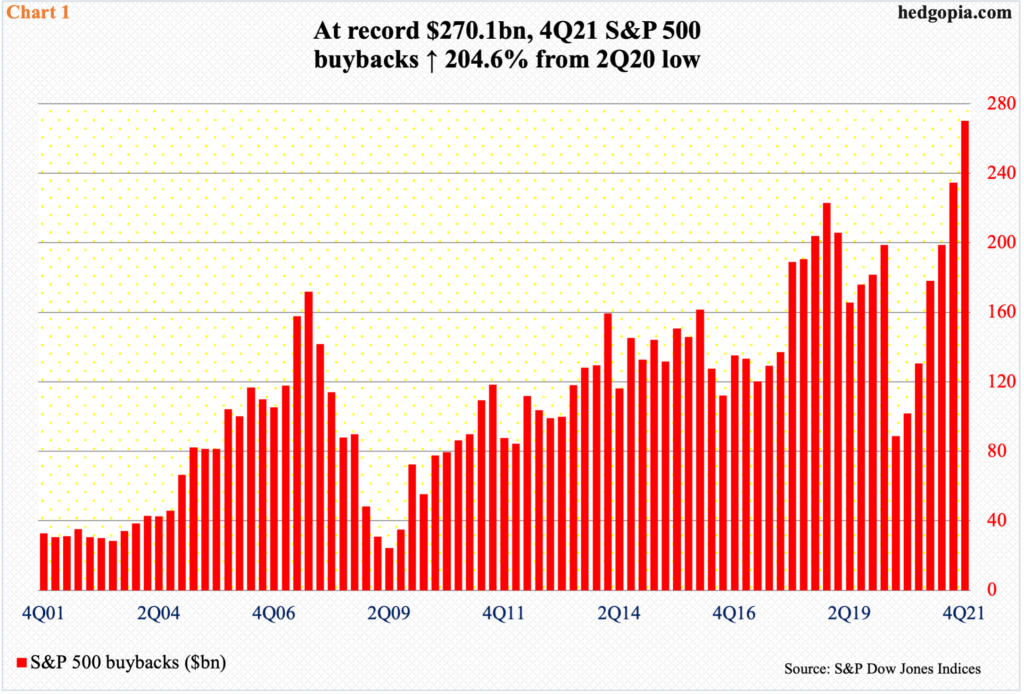
S&P 500 buybacks set a new record in 4Q21. The companies spent $270.1 billion in purchasing their own shares, easily eclipsing the prior high of $234.6 billion from 3Q21. Buybacks have grown each quarter since hitting the post-pandemic low of $88.7 billion in 2Q20 (Chart 1).
The momentum in all probability has continued in the current quarter, which is 10 trading sessions from being over. Through Wednesday, the large cap index is down 8.7 percent in the March quarter. These companies thus will have bought more of their shares cheaper, resulting in higher earnings per share.
As things stand, buybacks have provided a definite tailwind for large-cap stocks. The same cannot be said about foreigners’ buying pattern and margin debt. They are both acting as headwinds.
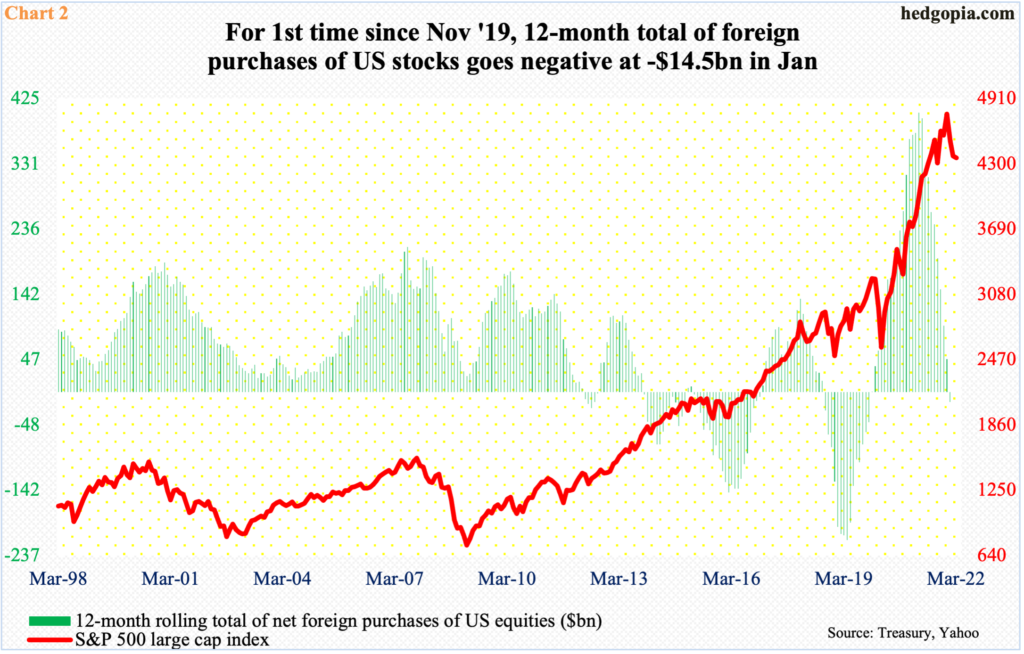
Foreigners continue to reduce exposure to US stocks. In January, they sold $50.7 billion worth – a record. In the 12 months to January, they cut exposure by $14.5 billion; this was the first negative month on a 12-month basis since November 2019.
As a matter of fact, the green histograms in Chart 2 went positive in December 2019 and stayed that way until December last year, with a record $404.7 billion last March. Since that high, foreigners have been cutting back. It seems the S&P 500 is catching up, albeit belatedly.
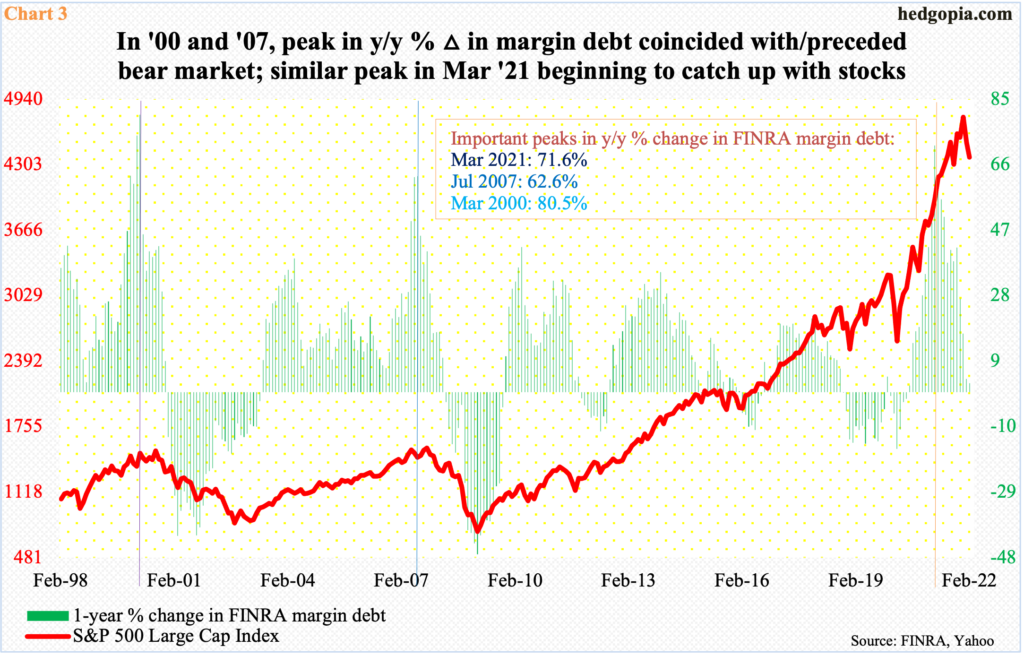
FINRA margin debt is the same way. Last March, it grew 71.6 percent year-over-year to $822.6 billion. This was on par with prior peaks from 2000 and 2007. In March and July respectively back then, margin debt grew 80.5 percent and 62.6 percent, coinciding or slightly preceding the onset of a bear market respectively.
This time around, the y/y growth decelerated from the March 2021 high, but margin debt kept rising, eventually peaking at $936.9 billion last October. By February, it was $100 billion lower, reaching $835.3 billion, up $5.6 billion from January. The S&P 500 peaked in January.
If past is prelude, the deceleration in y/y growth will gradually morph into negative growth. In February, this was still positive at 2.7 percent.
Amidst these tailwind-headwind dynamics, investor sentiment is approaching a critical juncture, which can eventually turn into a tailwind.
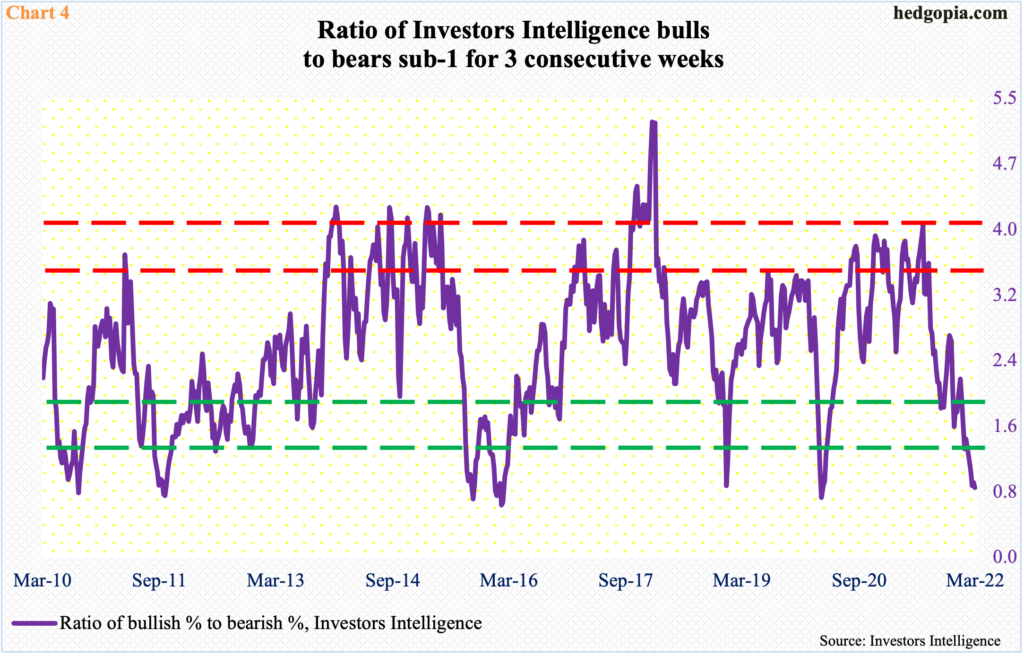
Measured by the Investors Intelligence survey, bulls this week were 30.6 percent, down 1.6 percentage points week-over-week, and bears 36.5 percent, up 0.9 percentage points w/w. Bears’ count was the highest since hitting 41.7 percent in the week to March 24, 2020; the S&P 500 reached a major low back then. In the current cycle, bulls’ low was 29.9 percent, which was hit in the week to March 1; this was lower than the March 2020 low of 30.1 percent.
As a result, the bulls-to-bears ratio this week was 0.84, preceded by 0.90 last week and 0.87 in the week before that. This is oversold territory (Chart 4). This gets unwound sooner or later. It is always possible the metric gets more oversold, but odds of unwinding grow with each push lower. In fact, we probably saw quite a bit of this on Tuesday and Wednesday, as the S&P 500 rallied 4.4 percent in those sessions. This week’s survey is as of Tuesday.
Thanks for reading!
