- North American oil rig count drops 37 percent in four months
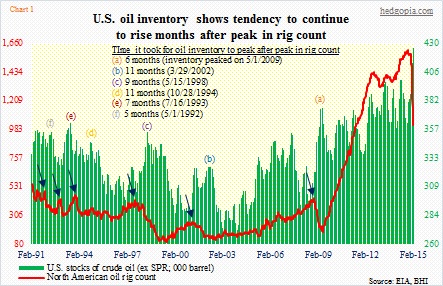
- Historically, oil inventory has tended to peak well after peak in rig count
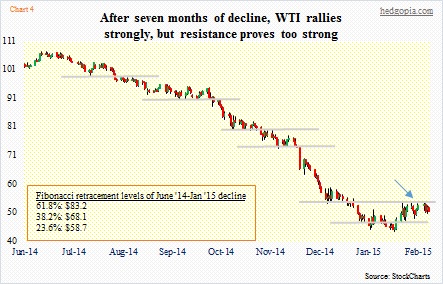
- WTI unable to take out $53.50-$54 resistance; near-term, path of least resistance down
One of the reasons thrown around for the firming price of crude is the rapid drop in the rig count. The conventional thinking is that this would sooner than later begin to impact U.S. production and crude inventory.
No question the decline in the rig count has been sharp. Since it peaked at 1,609 in the week of October 10th last year, the North American oil rig count has dropped 37 percent, to 1,019.
For reference, back in 2009 the rig count dropped 60 percent in seven months. In 2002, it declined 51 percent in 16 months, in 1999 by 77 percent in two years, in 1994 by 35 percent in five months, in 1993 by 28 percent in four months, and last but not least, in 1992 by 37 percent in eight months.
In this context, it can be argued that the 37-percent drop in the rig count so far is below average, particularly considering the spike it has had prior to this drop – from 179 in 2009 to 1,609 in October last year (Chart 1).
The other thing we learn from Chart 1 is this. At least going back to the early-1990s, oil inventory continues to rise well after peak in the rig count. In the chart, the blue arrows point to when the rig count peaked, and the letters in parenthesis above the green bars indicate when inventory peaked. The latter clearly lags – which has ranged from five to 11 months.
In the current cycle, it has been four months since the rig count peaked. In the week of 13th (this month), stocks of crude oil (excluding the Strategic Petroleum Reserve) reached an all-time high of 425.6k barrels, for a sixth consecutive weekly increase. Production of crude oil rose to 9.3mn barrels/day – also an all-time high. It is futile to even try to guess when these two will peak.
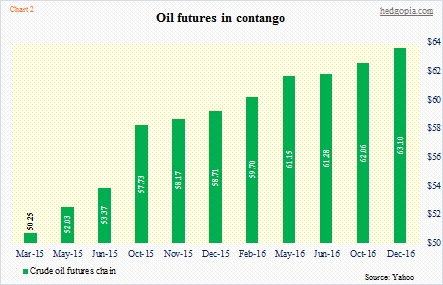
We do know this. Crude oil is in contango (Chart 2), and that may very well be behind the perky price action the past three weeks. From the intra-day lows on January 29, the WTI surged 24 percent in four sessions, and has more or less gone sideways since.
Looking at Chart 2, it is clear why buying spot and selling futures can be a profitable trade right now. If we assume that $6-$7/barrel covers expenses relating to storage, financing, insurance, etc., there is money to be made once one goes out six months and beyond.
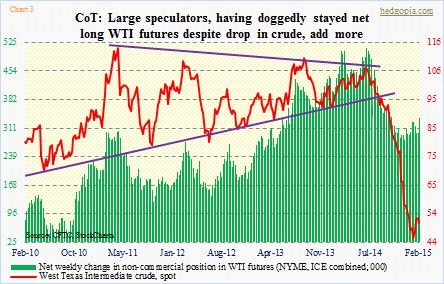
Is that the reason why non-commercials are not willing to let go of their rather-sizable net longs in WTI futures (Chart 3)? (Both NYME and ICE are combined in the chart.) These traders started cutting back in the middle of June, just when oil peaked. That was perfect timing. Oil continued lower, but their net longs troughed in the first week of December. Since oil bottomed late January, they have added even more. The question is: Should we follow or fade them?
As things stand now, fading probably is the safest bet. Chart 4 depicts the plight that oil has been in since June last year, characterized by persistent breakdown of support zones. The late-January advance stopped right where it was supposed to/could have (blue arrow). The $53.50-$54 resistance is proving to be a tough hurdle to jump over. The outlook changes if that resistance gets taken out. But until that happens, the path of least resistance is probably down. Daily indicators look ready to come under pressure.
Last week, the WTI (50.75) lost 3.7 percent. The dollar was essentially flat. Medium-term, oil likely gets help if the buck weakens, which is looking probable. But near-term, once again, $47 looks to be in play.


dick1931
Question: Who are the “large speculators”? Could they include oil producers somewhere trying to manage the price?
hedgopia
Large speculators, hedge funds and non-commercials are used interchangeably. Oil producers would be included in ‘commercial’, and they are heavily net short currently.