- U.S. retail sales disappoint again – has not grown four out of last five months
- Not much correlation between gasoline price and personal consumption expenditures
- RTH, which had diverged from weakening retail sales, has been weakening past seven weeks
U.S. retail sales were mediocre at best and flat out disappointing at worst. At $436.8 billion, they were flat month-over-month, versus expectations for a 0.2-percent gain. In the past five months, they have managed to grow only once, with March rising 1.1 percent. December-February were down months (Chart 1).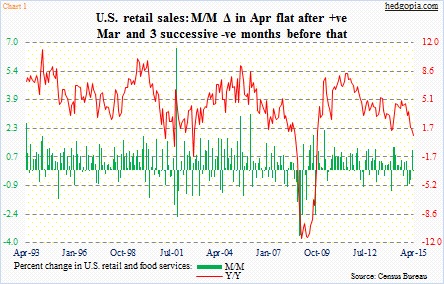
This is one more data point suggesting that 2Q15 has not gotten off to a great start.
Year-over-year growth in retail sales has been decelerating since last August, when they grew at five percent. The growth rate decelerated to 0.9 percent in April. Growth in the three-month average slowed to 1.5 percent in the month, and is below the 2.5-percent mark, which in the past has proven to be an important level (Chart 2).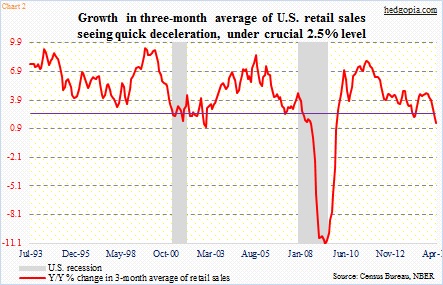
Ex-gasoline, y/y growth in the three-month average still looks healthy – up 4.3 percent in April, but down from 6.2 percent in January nonetheless.
Gasoline sales were $36 billion in April, down $10 billion from last May. Consumers are clearly having to spend less on gas, but, going by conventional wisdom, they seem reluctant to splurge their gas savings on other items.
Indeed, the personal savings rate rose from 4.4 percent last November to 5.3 percent in March (February was 5.7 percent). At the same time, crude oil has staged a massive rally the past couple of months, with the WTI up 45 percent. Using this logic, we could see further entrenchment in consumer spending in the coming months.
The truth is, there has not been much correlation between gasoline price and consumer spending, at least for a while. Chart 2 plots the price of regular gasoline against personal consumption expenditures, and it is rather revealing.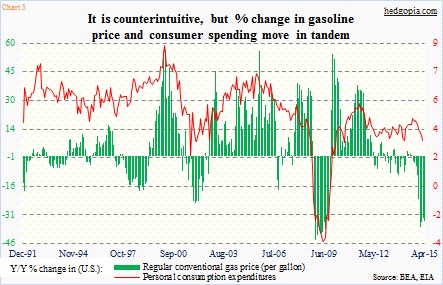
Year-over-year growth in PCE has been decelerating since last August. A gallon of regular gasoline cost $3.43/gallon in that month. Gasoline price peaked last June at $3.63 and troughed in January at $2.05. You would think this would help PCE. But it hasn’t. On an absolute level, PCE is higher. In fact, the March total of $12.2 trillion was the highest ever, but it is the rate of change that has been decelerating (Chart 3).
The fact is, consumer retrenchment is not taking place across all categories. Auto sales were $89.8 billion in April, essentially flat with the all-time high of $90.1 billion in March. This is one of the two major areas where credit growth is surging, the other being student loans (Chart 4). The latter in particular is on an unsustainable path, but at the same time taking an increasing share of consumer credit; in 1Q15, this was 40.8 percent, versus 23.9 percent in 1Q07.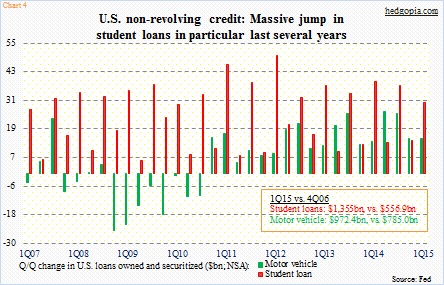
This has to impact sales elsewhere. And we are seeing that in the retail sales number.
Up until recently, retail stocks, represented by RTH, the retail ETF, totally ignored what was going on in the retail arena. Retail sales peaked at $441.4 billion last November. It was only late March – 23rd to be exact – that the ETF began showing signs of exhaustion, and since has traced out a lower highs, lower lows pattern (Chart 5). Interestingly, AMZN, which at 10.3 percent has the largest weighting in the ETF, has gone on to rally 14 percent since that date.
As I am writing this, despite the disappointing retail sales number, as well as M’s disappointing 1Q15, the ETF ($76.07) is holding its own, down 0.4 percent.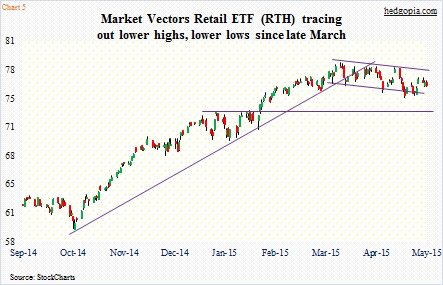
Here are a few things to keep in mind. The ETF’s 50-day moving average is rolling over. Weekly momentum indicators have turned lower. Some of them are approaching the middle of the range; in an uptrend, things can turn back up from here. So from an intermediate-term perspective, the ETF is in limbo. Near-term, the path of least resistance is probably down. In a worse-case scenario, it has room to drop to 73.
RTH only trades monthly options, not weekly. Trying to lock in 73 using options does not earn much premium. Worth waiting.
Thanks for reading.

