
After a decent three-week rally, the Russell 2000 hit a ceiling just short of 1600 two weeks ago. It closed last week right on the 200-day. A convincing breach raises the odds of a test of support at 1450s. This also says a lot about whether or not markets believe next year’s elevated earnings estimates for S&P 600 companies are realizable.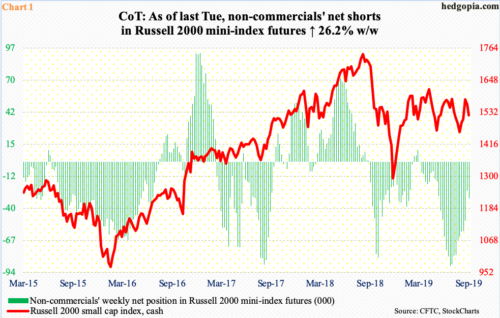
Non-commercials last week (as of Tuesday) added 6,492 contracts to their net shorts in Russell 2000 mini-index futures. This was the first week-over-week increase in 10 weeks. Mid-July, they were net short 88,737 contracts, which was the highest since October 2008.
A couple of weeks after these traders began to cut back their holdings, the cash tagged 1599.40 intraday on July 31, before coming under pressure. The Russell 2000 would not bottom until late August. Non-commercials kept reducing their holdings – until last week.
It is too soon to say if this represents a sentiment shift, but if it is, it would have come at an interesting juncture.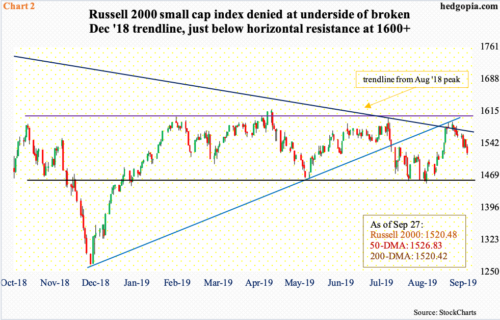
Small-cap bulls just got denied at a confluence of important resistance on the Russell 2000.
Late August, they defended two-year support at 1450s (black horizontal line in Chart 2). The rally that followed reclaimed both 50- and 200-day moving averages. Two weeks ago, it surged 4.9 percent, breaking out of a falling trend line from August last year. But this was not enough to take care of other roadblocks.
The intraday high of 1590.50 on the 16th just fell short of important resistance just north of 1600, which goes back to January last year. This also kissed the underside of a broken trend line from last December. Last Friday, the index pierced through the 50-day, closing right on the 200-day. A breach exposes it to a test of the aforementioned 1450s.
The weekly is beginning to get extended. Hence the significance of how things evolve in the next several sessions.
The inability to jump over the 1600 hurdle likely contains a message. This is a spot where bulls are hesitating to add, even as bears are showing a little bit of aggression. This is taking place even as small-business profit trend is holding up near its record high.
Chart 3 pits the Russell 2000 against the NFIB ‘actual earnings changes’ sub-index. In May last year, the latter hit an all-time high of 3. Then by February this year, the green bars were down to minus nine, before improving. August was minus one, versus minus five in July.
Directionally, the two tend to follow each other well. This time around, the index (1520.48) peaked in August last year at 1742.09, meaning it is 14.6 percent from that high. Bulls are not quite convinced the current profit trend will last.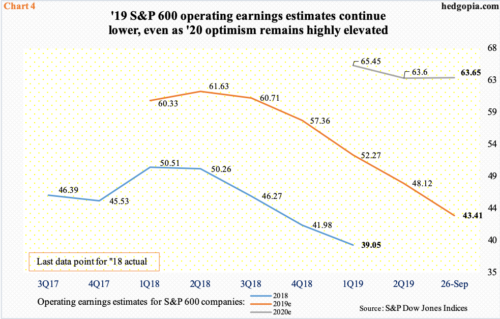
There is a similar message coming out of Chart 4. Investors are not buying sell-side optimism for next year’s estimates. As of last Thursday, S&P 600 companies were expected to earn $63.65 in operating earnings. This is lower than the $67.63 expected in February, although the revision trend has turned up the past couple of months. (The recent trend higher in next year’s estimates is not quite evident in the chart because it uses quarter-end numbers.)
If 2020 estimates come through, earnings would have grown 46.6 percent over this year, which is hard to swallow given the downward revision trend this year. At least that is how markets are treating the prevailing sell-side optimism. In June last year, these analysts were expecting $61.63 for this year, which has now dropped to $43.41. Things evolved similarly last year, with expectations of $50.66 in March last year; when it was all said and done, $39.05 was rung in.
Hence the significance of 1600. This ceiling likely cracks the moment markets decided 2020 estimates were achievable, which is not the case currently.
Thanks for reading!
