
From the sales point of view, U.S. housing remains way below the bubble highs of a decade ago, but several other metrics have pushed into record territory.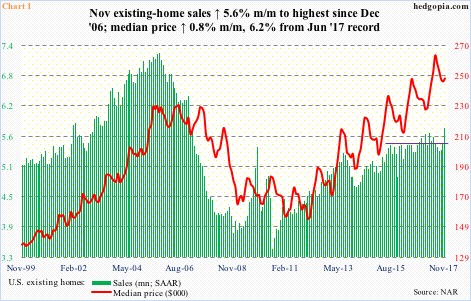
November’s existing home sales were published this week. They were up 5.6 percent month-over-month to a seasonally adjusted annual rate of 5.81 million units. This was the highest since 6.42 million in December 2006.
Sales have gradually trended higher since bottoming at 3.45 million in July 2010. Despite this recent momentum, sales are not even remotely close to the bubble peak. Back in September 2005, they peaked at 7.26 million (Chart 1).
New home sales are the same way. November’s numbers will be reported tomorrow. October was up 6.2 percent m/m to 685,000 units (SAAR) – a decade high. The all-time high of 1.39 million was recorded in July 2005.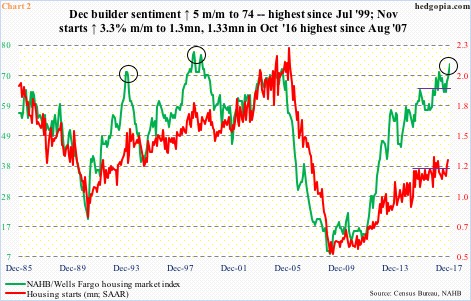
Housing starts, too, have sprung back to life, but, once again, nowhere near the peak nearly 12 years ago.
Starts peaked in January 2006 at 2.27 million units (SAAR). In November, they rose 3.3 percent m/m to 1.3 million, just under 1.33 million in October 2016, which was the highest since August 2007 (Chart 2).
Starts continue to lag builder sentiment, which is near record territory.
The NAHB housing market index jumped five points m/m in December to 74. This was the highest since 75 in July 1999. In December 1998, the index peaked at 78.
The gap between builder sentiment and starts keeps getting wider (Chart 2). In the past, sentiment in due course has tended to retreat, which then puts downward pressure on starts. In this scenario, supply constraints remain. There is already a mismatch between demand and supply.
In November, months’ supply of existing homes was merely 3.4, versus 11.9 in July 2010. Supply of new homes is not that tight. Still, October’s 5.2 was at a four-month low.
One direct consequence of this mismatch is felt in the price – another metric that has pushed into record territory.
The median price of an existing home peaked at $263,300 in June this year, inching up 0.8 percent m/m in November to $248,000 (Chart 1). Similarly, the median price of a new home peaked at $327,000 last December, with October this year down 3.2 percent m/m to $312,800.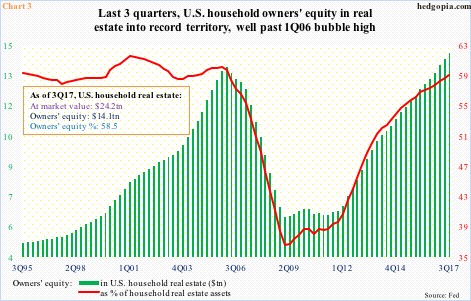
While this persistent strength in the price must be shutting out quite a few potential buyers, this has had a positive impact on owners’ equity. As a matter of fact, this metric just moved into record territory.
Back in 1Q06, owners’ equity in household real estate peaked at $13.4 trillion. Subsequently, it was more than cut in half before bottoming at $6 trillion in 1Q09. That high was surpassed in 1Q of this year, with 3Q at $14.1 trillion – a new record.
In 3Q17, homeowners’ equity made up 58.5 percent of real estate’s market value – the highest since 59.2 percent in 1Q06. From the wealth effect perspective, this has to be a tailwind for the economy. The rising equity is a confidence-booster for sure. This was exactly what transpired during the housing bubble of a decade ago.
The difference between then and now is that, while nearly every metric was pointing to excesses back then, it is less so now, but the list is growing.
Thanks for reading!
