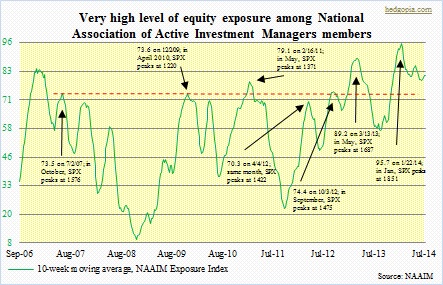
 The Bank of America Merrill Lynch’s July survey of fund managers was out the other day, and shows how lop-sided investor sentiment is at the moment. A net 61 percent are now overweight equities. The reading is highest since early 2011, a year that does not quite bring up good memories. The S&P 500 index peaked in May that year and dropped 22 percent by the time it troughed in October. The attempt here is not to suggest that we are headed for a similar drop, rather to point out the risks inherent any time the majority bets in one particular direction. Obviously, there is no hard-and-fast rule as to how/when an overextended metric should begin to mean-revert. The accompanying chart serves as a good example. The NAAIM Exposure Index shows members’ exposure to U.S. equity markets. First, the message is the same as being broadcast by the Bank of America survey – that sentiment is too bullish among equity money managers. Secondly, a reading in low- to mid-70s traditionally has been a place to cut back on longs/initiate shorts. In the chart, the seven identified spots preceded a drop in the S&P 500 index of at least five percent. The last time the index suffered that kind of a decline was early this year. Throughout that January-February drop and since, the NAAIM reading has been in the low-80s or higher – historically an unsustainable number. But that has not stopped the index – and its 10-week moving average – continue to stay extended.
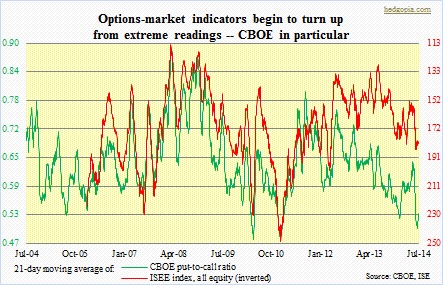
In this context, is there any message coming out of the chart below? Needless to say, both the ISEE index and the CBOE put-to-call ratio have been flashing complacency among equity investors. The latter in particular has reached extreme readings. Lately, it has turned up – troughed early this month. Historically, once that process begins – particularly from these levels – it will be some time before these off-the-chart readings get unwound. And as that happens, equities tend to come under pressure. 

