
There are signs growth is decelerating, but from a healthy level. Data relating to orders and inventories do not yet seem to be a problem, but worth watching.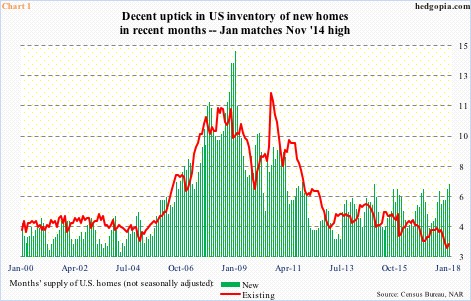
Most of this week’s economic data offered more of a downside surprise than upside. Growth in real GDP for 4Q17 was revised lower by one-tenth of a percentage point to 2.5 percent. The pending home sales index in January fell 5.2 points month-over-month to 104.6 – the lowest since 104.1 in October 2014.
January’s new home sales similarly fell another 7.8 percent m/m to a seasonally adjusted annual rate of 593,000 units, following a 7.6-percent decline in December. November’s 696,000 units were the highest since 727,000 in October 2007, so sales are softening from a decent level.
At the same time, inventory of homes for sale is inching up. In January, there were 299,000 new homes for sale. This was the highest since 300,000 in April 2009. Months’ supply was 6.8 in January, up from 4.3 last March (Chart 1). The chart also shows supply of existing homes, where the metric remains low.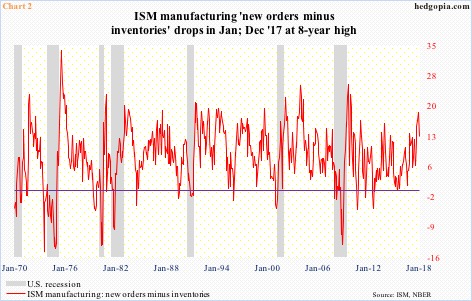
Interest rates have backed up in recent months, with 10-year Treasury yields having risen from 2.03 percent last September to 2.94 last week. Concurrently, the 30-year fixed mortgage rate last September bottomed at 3.78 percent, and was 4.44 percent last week. This has to have an impact on home sales. Mortgage applications are down.
The good thing is, activity is softening from a relatively high level. The 2.5-percent growth in real GDP in 4Q17 followed growth of 3.2 percent in 3Q and 3.1 percent in 2Q.
Along the same lines, the ISM manufacturing index in January inched down two-tenths of a point m/m to 59.1, but last September’s 60.2 was the highest since June 2004. (February’s numbers come out later this morning.)
Nothing goes up forever. A little deceleration is only natural. The question is, what kind? Thus the need to keep an eye on orders and inventories. If weakness persists, it would not take long for the red line in Chart 2 to continue lower.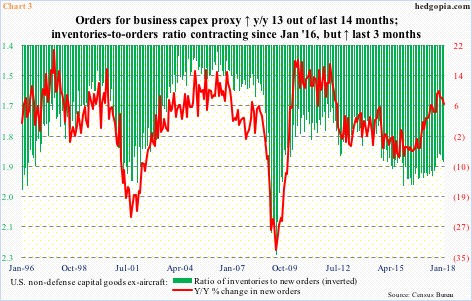
A similar dynamic is in play in Chart 3.
January orders for non-defense capital goods ex-aircraft – proxy for business capex plans – fell 0.2 percent m/m to $66.7 billion (SAAR). This was the second straight monthly decline. Year-over-year, orders rose 6.3 percent, but growth has decelerated since last October’s 9.9-percent pace.
Accordingly, after persistently dropping since peaking in December 2015, the ratio of inventories to orders has been inching higher the last three months. Nothing crazy, but if the trend persists, it needs watching. Ditto with Chart 4.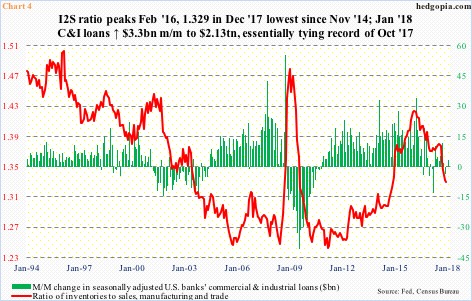
The ratio of inventories to sales in manufacturing and trade peaked in February 2016. As of last December, the red line in Chart 4 was still falling, reaching the lowest since November 2014. Accumulated inventories are getting digested.
From February 2016 through last December, these inventories grew 5.3 percent to $1.9 trillion (SAAR), while sales jumped 12.6 percent to $1.4 trillion. Lesser inventory build impacts banks’ commercial & industrial loans, which grew 6.9 percent from February 2016 to January’s $2.13 trillion. The level of loans has gone sideways the last four months.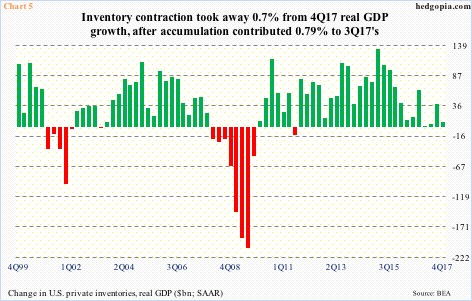
Inventory digestion also impacted GDP in 4Q17. Investment in private-sector inventory declined during the quarter (Chart 5), taking away 0.7 percent from real GDP growth. This was in contrast to contribution of 0.79 percent to 3Q17 growth.
The point in all this is that a pickup in sales in recent months/quarters has led to inventory digestion. Orders likewise have grown. While positive, there is another side to the coin, which is that things seemingly are decelerating. Orders lead to inventory build. Thus, depending on the magnitude and duration of growth deceleration, it can become an issue – again – thus needs watching.
Thanks for reading!
