
- Russell 2000 suffers false breakout before retreating quickly
- Hedge funds not showing much interest in going net long RUT futures
- With 200DMA one percent away, small-cap bulls have opportunity to put foot down
The Russell 2000 Small Cap Index is back below what could potentially have been a major breakout. The index was able to push through a multi-month range, stay above it, but did not have enough momentum to maintain that direction (Chart 1). Off the intra-day high of December 31st, it has now retreated nearly five percent. It is obvious traders who had jumped on the bandwagon expecting a breakout closed their positions. Yesterday, right from the open, IWM, the small-cap ETF, was getting sold/shorted at/around resistance of a shorter time frame (blue arrow in Chart 1). This thing has now fallen back into the range.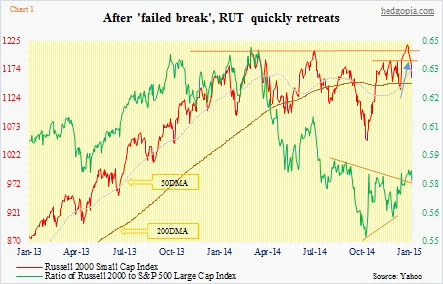
There are probably a few lessons in this saga.
1. It is dangerous to be solely relying on the seasonality narrative. True, small-caps tend to do well in January. But each January is different, as are macro/micro variables and cycles (both secular and cyclical).
There is no shortage of seasonality memes on the Street. In both 2013 and 2014, the ‘sell in May and go away’ did not work. In 2014, January was a down year, but went on to rally 11 percent for the year. This past December, there was no Xmas rally, as most major U.S. indices ended in the red; the Russell 2000, on the other hand, added 2.7 percent in the month. Traders were obviously positioning for a January small-cap effect. More often than not, this in and of itself becomes a problem. The more popular a particular pattern, the more the number of people trying to preempt.
2. “Smart money” was far from buying the recent enthusiasm in small-caps. The last time non-commercials were net long Russell 2000 mini-index futures was late March last year (Chart 2). If you recall, that was when the Russell 2000 peaked and started going sideways within a range. That was also when the ratio of Russell 2000 to the S&P 500 Large Cap Index peaked (Chart 1). These non-commercials went net long early April last year and began adding until the end-September peak of 73k contracts. They then started cutting back, but have not been net long since. To be clear, they are not always right. Obviously. But they can be good at latching on to a trend. The latest futures tally is as of December 30th. By then, the Russell 2000 had already taken out the March high, although barely. But that was not enough to convince these traders that a genuine breakout was in the making.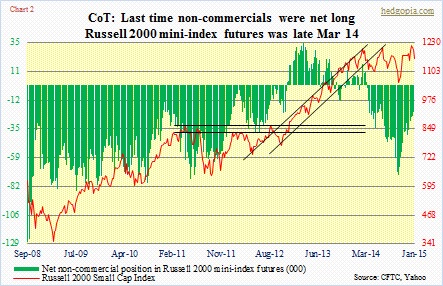
3. Inter-market analysis is a good tool to have. HYG, the high-yield corporate bond ETF, has been performing miserably since late June last year. Even during the latest run, HYG peaked four sessions earlier than IWM.
In the same vein, small-caps do well when the dollar is strong. The greenback has gone parabolic since July last year. Small-caps, not. Yes, a strong dollar tends to hurt exporters more than domestically-focused companies, but in the big scheme of things this analysis cannot be this simple. When it is all said and done, what is causing the dollar to rally and whether or not the currency strength has the potential to destabilize things are perhaps more important.
4. If someone traded IWM just on the basis of golden cross that occurred on the ETF mid-December, s/he has probably lost money. Technicals are an important tool, but not a be-all and end-all. These are patterns. Sometimes they work, sometimes they don’t. Sometimes they can self-fulfill. But not this time as far as IWM is concerned.
The bottom line is this.
Small-cap bulls wasted a golden opportunity by not being able to hang on to a breakout. Here is another that is set to test their will. The 200-day moving average on the Russell 2000 (1161) is only one percent away.
