
- SMH’s latest rally attempt gets rejected at underside of broken Oct 2014 trendline
- Past 3 months, some semi outfits have seen estimates revised up, some down
- ETF has retraced 61.8% of Mar 00-Nov 08 decline; may mean pause/stop
In the past week, both bulls and bears have scored points as far as semis go. Sort of!
Bulls stepped up to the plate to defend 52.50 on SMH – a must-hold (Chart 1). A break probably dictates near- to medium-term direction. Kudos to bulls for having saved that. Although it just may be a little premature to celebrate. Bears got active where it was safer for them to do so – that was the underside of the broken October 2014 trendline. The ETF did not even get to test $55.50-$56 resistance.
As a result, the limbo continues. The ETF is trapped within a range.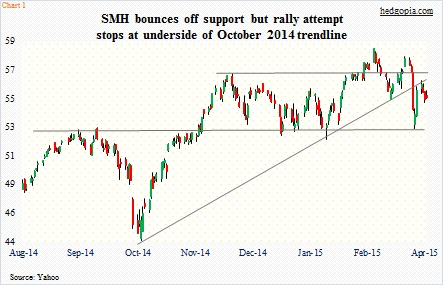
This has come at a time when it sits at what could very well be an inflection point. If we look at Chart 2, we see what kind of a roller-coaster ride it has been the past 15 years. A parabolic move that peaked in March 2000, then a collapse into September 2002, followed by a sideways pattern bottoming in November 2008. Since that trough, the ETF has retraced 61.8 percent of the March 2000-November 2008 decline. A Fibonacci follower would tell you this is an important number. More often than not, price tends to pause, or even stop, at this retracement. (By the way, the chart uses closing price, while intra-day price has been used to calculate Fib retracement levels.)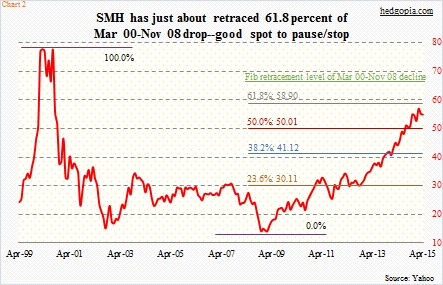
Given this, the 1Q earnings season getting underway next week probably takes on added importance.
As things stand now, the bar is low. Earnings for S&P 500 companies are expected to drop 4.6 percent year-over-year, versus forecast of 4.3 percent increase three months ago (courtesy of FactSet). Info tech is expected to drop one percent, versus expected growth of 4.6 percent three months ago.
Semis are no different.
Just to get an idea, versus three months ago INTC’s 1Q estimates have gone down from 51 cents to 41 cents (FY 2015 from $2.37 to $2.14), XLNX’s from 63 cents to 50 cents (2015 from $2.48 to $2.36), SNDK’s from $1.37 to 71 cents (2015 from $6.62 to $4.46), ALTR’s from 38 cents to 32 cents (2015 from $1.79 to $1.64), and BRCM’s from 75 cents to 60 cents (2015 from $3.32 to $2.80).
The good thing is, it is not all murky and lackluster in semi land. There are companies that have experienced upward revisions as well – AVGO from $1.68 three months ago to $1.99 (2015 from $7.46 to $8.40), NVDA from 24 cents to 26 cents (2015 from $1.16 to $1.20), QCOM from $1.28 to $1.33 (2015 from $5.21 to $5.02), and TXN from 63 cents to 62 cents (2015 from $2.89 to $2.91). (NVDA’s and AVGO’s quarter ends in April; QCOM’s FY ends in September, AVGO’s in October, and NVDA’s in January.)
This probably lays the groundwork for a tug of war ahead between bulls and bears. The range described above should give us clues.
In the end, Fibonacci may just prove too strong to conquer in the medium- to long-term.
