
S&P 500 buybacks declined substantially in the second quarter. The trend is likely to persist. Historically, the S&P 500 and buybacks move in tandem. The two have diverged big time in the current quarter. As the hitherto tailwind turns into a headwind, the divergence is unlikely to continue.
After five consecutive up months, the S&P 500 is down 2.8 percent September-to-date. From its record high 3588.11 on the 2nd this month, the large cap index is down 5.2 percent and was down 7.7 percent at Friday’s low of 3310.47, which slightly undercut the 50-day. Bulls used the average as an opportunity to step up.
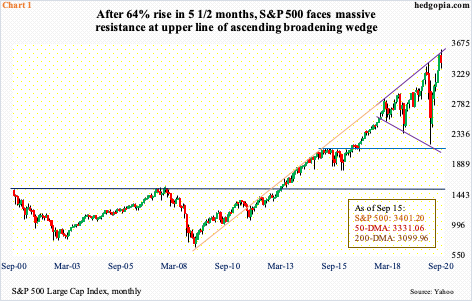
The latest decline preceded a nearly 64 percent surge from March 23 when the February-March selloff bottomed. That low came right on the lower line of an ascending broadening wedge, which approximated five-year horizontal support (Chart 1).
Now, the index is at the upper line of the wedge. Thus far, it has been rejected. This is coming at a time when the index remains overbought on both the weekly and monthly. To rub salt into the wound, buybacks, which provided a consistent tailwind for the index in particular and stocks in general are turning into a headwind.
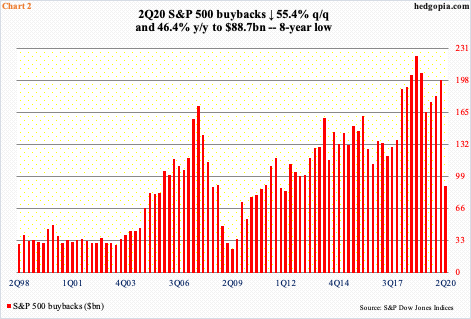
The S&P 500 jumped 20 percent in 2Q. The performance followed the aforementioned massive selloff in February and March and came without much help from buybacks. During the quarter, S&P 500 companies spent $88.7 billion in buybacks – an eight-year low (Chart 2), and down 55.4 percent from the previous quarter and 46.4 percent from four quarters ago.
For comparison purposes, these companies bought back a record $223 billion worth in 4Q18, which made up 75.9 percent of $293.8 billion in operating earnings; throw in another $119.8 billion in dividends, this was not on a sustainable path.
In 2Q20, buybacks made up 40.1 percent of $221.1 billion in operating earnings, which was sufficient to also absorb another $119 billion in dividends, but just about. These companies are clearly swallowing more than they can chew. In all probability, of buybacks and dividends, they would not want to touch the latter as long as possible, meaning the former is vulnerable, and it is showing.
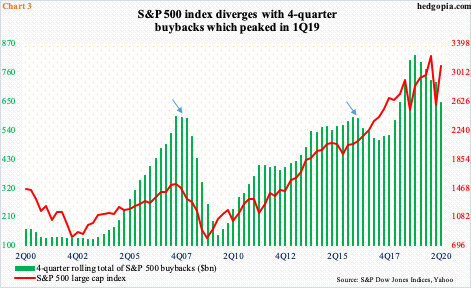
Despite the collapse in 2Q20 buybacks, on a four-quarter basis, the total still looks good, because buybacks were solid in the prior three quarters. The $644.9 billion pales in comparison to the record total of $823.2 billion in 1Q19 but remains massive, staying above 2007 and 2016 highs (arrows in Chart 3). Viewed this way, the path of least resistance remains down.
In 2Q20, the top 20 companies did the heavy lifting, accounting for 87.2 percent of the buybacks, versus 46.7 percent in 1Q20. Apple (AAPL) alone spent $17.6 billion, down slightly from $18.8 billion in 1Q20. Importantly, as pointed out by S&P Dow Jones Indices, 252 issues reported little or no buybacks for the quarter, versus 105 in 1Q20.
The point is, buyback momentum is shifting. To the surprise of many, in the face of Covid-19, companies spent big in 1Q20 – $198.7 billion. It now turns out that was an aberration. In 2Q20, financials aggressively retreated and are unlikely to shift the gear higher anytime soon. Tech likely will continue to spend but will be unable to singlehandedly fill the vacuum left by other sectors.
This is important because, if past is prelude, the S&P 500 moves in tandem with how buybacks go. In the current quarter, the index has diverged, as it rallied another 15.7 percent before coming under pressure nine sessions ago. This cannot continue – either buybacks reaccelerate (unlikely) or the S&P 500 catches up (likely).
Thanks for reading!
