
Buybacks acted as a massive tailwind leading up to and as the S&P 500 peaked in January last year. Spending has come down quite a bit and is increasingly turning into a headwind.
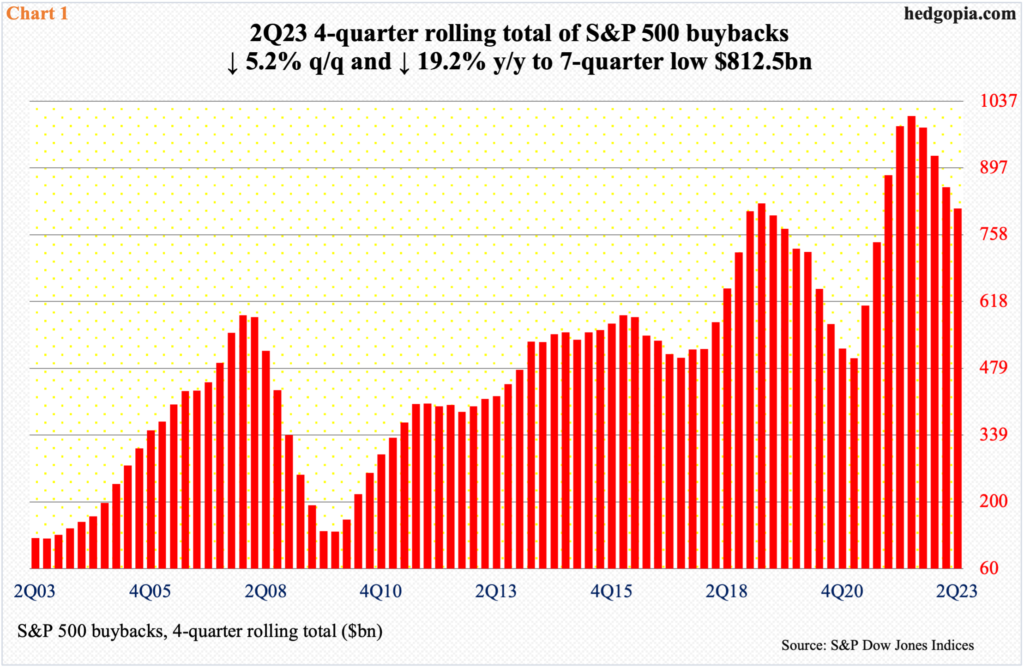
Share buybacks by S&P 500 companies are trending lower from a very elevated level. In the June quarter, they spent $174.9 billion – a 10-quarter low. A record $281 billion was spent in the March quarter last year.
On a four-quarter rolling total basis, 2Q23 spending was $812.5 billion, which is just an astounding sum of money; still, spending was at a seven-quarter low – down both quarter-over-quarter and year-over-year, respectively by 5.2 percent and 19.2 percent (Chart 1).
Buybacks constituted a reliable source of demand for shares. Post-Covid, the four-quarter total bottomed at $499.2 billion in 1Q21, subsequently reaching as high as $1,005.4 billion in 2Q22. The drop since that peak has acted as a headwind for stocks.
Indeed, on a quarterly basis, 3Q21 buybacks were $234.6 billion, which set a record. This was surpassed in the very next quarter as companies spent $270.1 billion in 4Q21, which was again broken in 1Q22 with spending to the tune of the previously mentioned $281 billion.
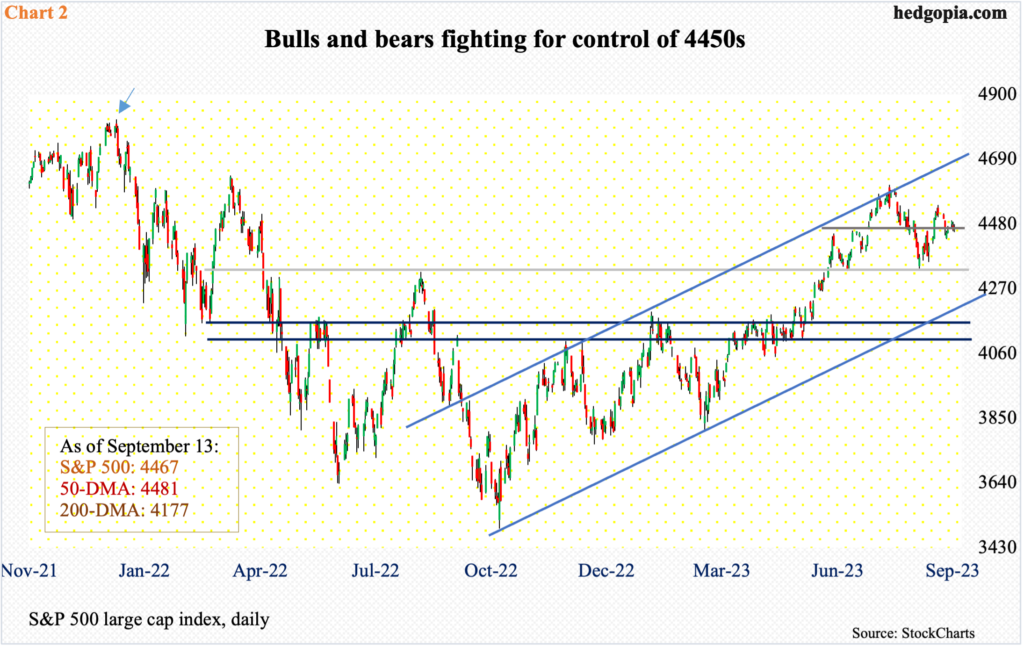
The Nasdaq 100 index and the Russell 2000 small cap index both peaked in November 2021. The S&P 500 peaked two months later in January next year, tagging 4819 (arrow in Chart 2). The large cap index subsequently bottomed at 3492 last October. The rally that followed stopped in July at 4607 – establishing a pattern of lower highs, as sellers showed up before the March 2022 high of 4637 could be genuinely tested.
Currently, bulls and bears are fighting for control of 4450s, which also approximate the 50-day moving average at 4481. A breach would open the door for breakout retest at 4320s. The S&P 500 closed Wednesday at 4467.
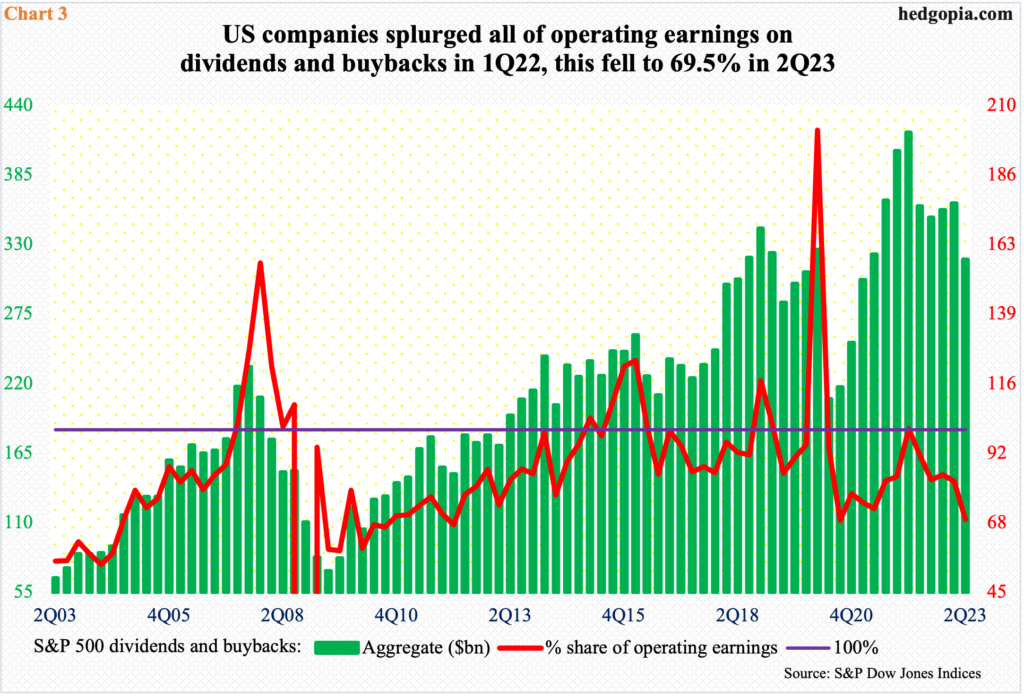
S&P 500 companies also spend generously on dividends. The four-quarter total set a record at $576.4 billion in the June quarter. On a quarterly basis, $143.2 billion was spent last quarter, down from the March quarter’s record $146.8 billion, with a dividend yield of 1.6 percent in 2Q23 at a five-quarter low.
In 1Q22, the share of dividends and buybacks exceeded S&P 500 operating earnings – $137.6 billion, $281 billion and $417.2 billion, in that order. In the June quarter, this dropped to 69.5 percent. This looks sustainable historically, but the downside emanating from this is that this equates to lesser buyback tailwind for the S&P 500, even as the index yields less.
Odds favor these dynamics get more complicated next year.
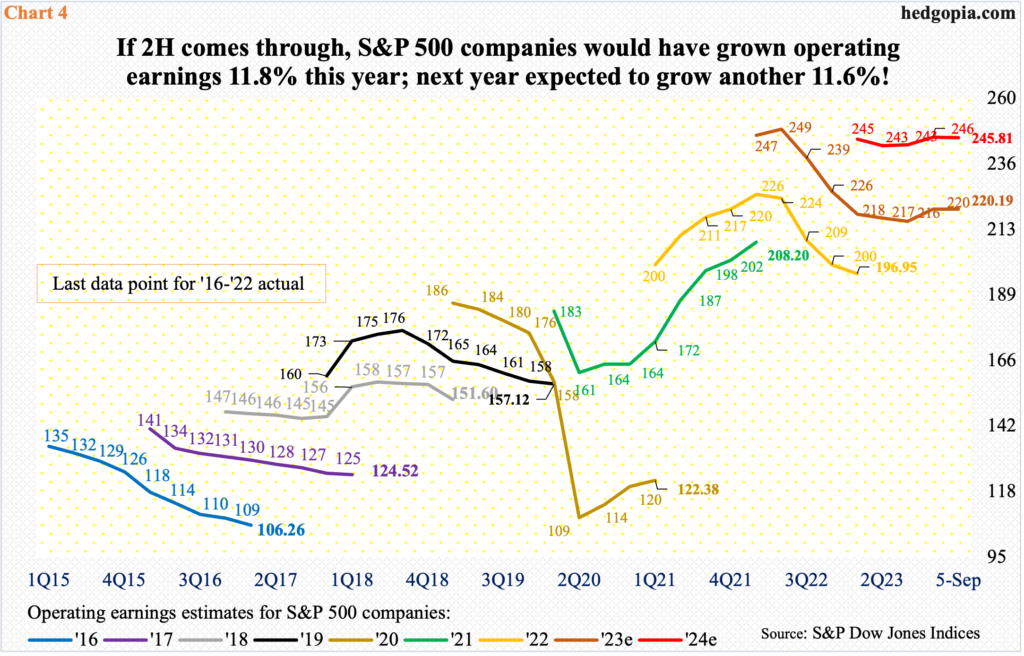
As of Tuesday last week, with 2Q earnings just about over, S&P 500 companies brought home $54.78 in operating earnings, coming on the heels of $52.54 in the first quarter, for a first-half total of $107.32. In the second half, the sell-side expects $112.87. If these estimates come through, the $220.19 total for this year would have grown 11.8 percent over last year’s $196.95.
Next year’s is a lot more uncertain. The sell-side expects this year’s positive momentum to carry through to 2023, penciling in $245.81, up 11.6 percent from this year. What probably comes in the way of this optimism is the interest rate environment, which has tightened quite a bit. Between March last year and July this year, the fed funds rate has gone up by 525 basis points to a range of 525 basis points to 550 basis points. It is anyone’s guess as to how much of this tightening is yet to filter through to the economy, but it is probably safe to assume that things are not going to accelerate. If that happens, the Federal Reserve will have no option than to double down on its tightening campaign lest inflation resurges.

This will have come at a time when multiples continue to remain at the high side.
Chart 5 takes a ratio of S&P 500 market cap to nominal GDP. Since bottoming at 0.99 in 1Q20, the ratio persistently rose, peaking at 1.65 in 4Q21 (arrow), when the index was valued at $40.4 trillion and the economy at $24.5 trillion.
In 2Q23, the ratio was 1.41, with the market cap at $37.2 trillion and nominal GDP at $26.3 trillion, having risen from 3Q22’s 1.16. This is elevated territory, although lower than the 4Q21 high.
Buybacks played a major role in the S&P 500 reaching that $40.4-trillion market cap. Now that companies are spending less, buybacks are no longer as potent a force, if not outright headwind. This probably is not yet reflected in how the index trades.
Thanks for reading!
