
Quite a year 2016 turned out to be! Stocks did not quite get off the starting blocks in an ideal fashion.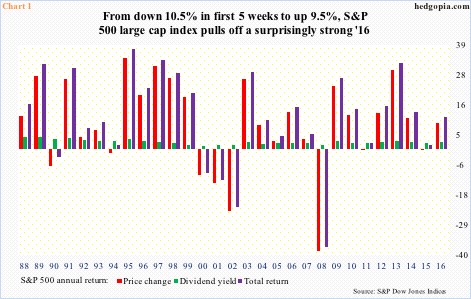
The S&P 500 large cap index opened 2016 down 1.5 percent on January 4 (was down as much as 2.6 percent intra-day). It dropped six percent in the first week, and was down 10.1 percent by the time it bottomed on February 11.
From that anemic opening weeks to up 9.5 percent when it was all said and done, 2016 turned out to be an above-average year (Chart 1). (Post-election alone, the index added 4.6 percent.)
The so-called January barometer – that the first month sets the tone for the year – did not deliver; the S&P 500 was down 5.1 percent last January.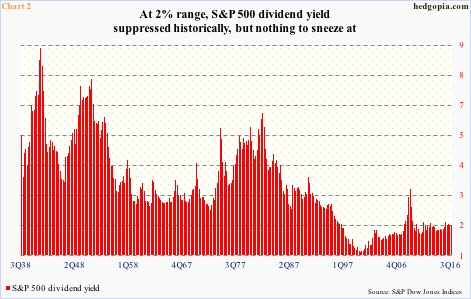
Besides the 9.5-percent change in the price, dividend yield contributed 2.4 percent to the performance of the S&P 500, resulting in a total return of just under 12 percent (Chart 1), which is just about even with the average going back to 1988.
In the current cycle (post-Great Recession), dividend yield peaked in 2009 at three percent (2008 was 1.5 percent, and 2015 2.1 percent). While respectable, the current yield pales in comparison to yesteryears.
In 1Q42, yield was as high as 8.6 percent, then progressively went down until it bottomed at 1.1 percent in 1Q00 (Chart 2). (Leading up to the bursting of the dot-com bubble in March 2000, stocks were insanely expensive, hence putting downward pressure on the yield.)
The ups and downs in dividend yield over the years/decades is best reflected in Chart 2. While much weaker versus historically, yields in the two percent range are nothing to sneeze at.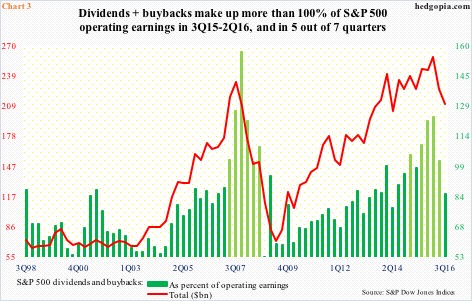
Hence the question, how sustainable is the current payout ratio?
Chart 3 is relevant in this respect. In it, the red line represents the amount of money doled out by S&P 500 companies in dividends and buybacks, and the green bars the share of dividends and buybacks in operating earnings. The lighter green bars represent the quarters in which dividends and buybacks exceeded operating earnings. And of late there have been quite a few.
In 1Q16, for instance, dividends were $96.7 billion and buybacks $161.4 billion, for a combined total of $258.1 billion, versus $209 billion in operating earnings. The mismatch is clearly unsustainable. In 3Q16, these companies only bought back $112.2 billion worth, while dividends were $98.4 billion. Together, they made up 84.9 percent of $248 billion in operating earnings – still high albeit better than 100 percent or higher. Importantly in 3Q16, dividends maintained the tempo.
Between buybacks and dividends, if the need be, corporations will cut buybacks first, and will only dare cut dividends in a worse case.
Incidentally, buybacks have been a big boost to stocks. The four-quarter total peaked in 1Q16 at $589.4 billion, with 3Q16 at $547 billion. If they have indeed peaked, this sooner or later will get reflected in stocks. Assuming no drastic change in payouts, a lower S&P 500 in a roundabout way will help further boost the yield – which increasingly looks like a likely scenario.
Thanks for reading!
