
Next week, 3Q18 earnings season gets underway. Estimates are a little lower than when the quarter began. This should help companies meet/beat numbers. Elsewhere, year-over-year growth in 2018 estimates has peaked. Historically, this has had repercussions for the S&P 500.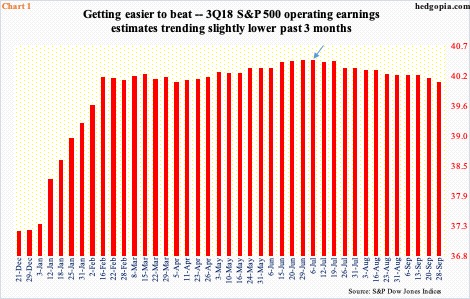
Just in time for 3Q18 earnings season that begins in earnest next week, the sell-side is beginning to lower estimates. At the end of September/3Q, operating earnings estimates for S&P 500 companies were $40.05. When the quarter began, the consensus was $40.47. The $0.42-cent drop also reverses the two-quarter wonder that was witnessed in 1Q18 and 2Q18, when estimates actually went up during the quarter – by $1.78 and $0.16, in that order. But that was more of an exception than a rule.
In the past, estimates were routinely pushed lower just before these companies began reporting. In 4Q17, between the end of September and the end of December, estimates were cut back by $0.51, in 3Q17 by $0.50, in 2Q17 by $0.83, and in 1Q17 by $0.99, to name a few.
As far as 3Q18 is concerned, the end-June high of $40.47 was also the high for the quarter (arrow in Chart 1). Estimates have slightly come under pressure since. Once again, if past is prologue, estimates should continue to head lower as the earnings season progresses. The downward revision trend is also beginning to manifest itself in 2018 numbers.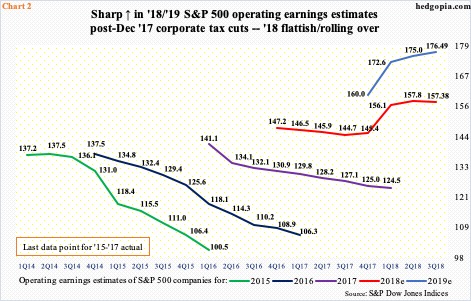
With two more quarters to go, this year’s estimates peaked at $158.24 late July. Last Friday, they were $157.38. Chart 2 uses quarter-end numbers, so does not quite reflect the intra-quarter ups and downs, but even here 2018 is beginning to roll over. Estimates for next year have peaked as well – at $177.13 early August versus $176.49 last Friday – although this is not evident in the chart.
With three months to go before 2019 begins, the sell-side beginning to lower next year’s estimates makes sense. Historically, these analysts start out optimistic and gradually lower their numbers as time passes. Particularly post-tax cuts of last December, the sell-side got very aggressive in pushing numbers higher. This helped multiples expand. When the time comes to lower them, this can have repercussions elsewhere.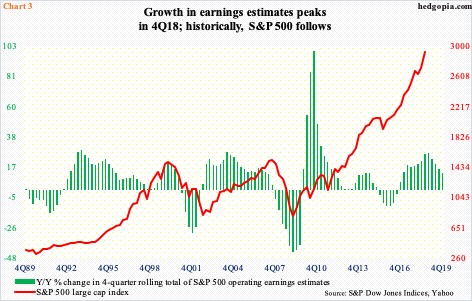
Chart 3 plots the S&P 500 with year-over-year change in four-quarter rolling total of S&P 500 operating earnings estimates. Investors do tend to pay attention to the change in revision trend. As mentioned earlier, the four-quarter total in 4Q18 is at $157.38, up 26.4 percent from a year ago. This is the highest growth rate since 1Q11. As things stand, by 4Q19, the growth rate would have slowed to 12.1 percent. This deceleration has potential to catch up with the S&P 500 in quarters ahead, assuming the historical relationship holds. Although there is one difference this time around.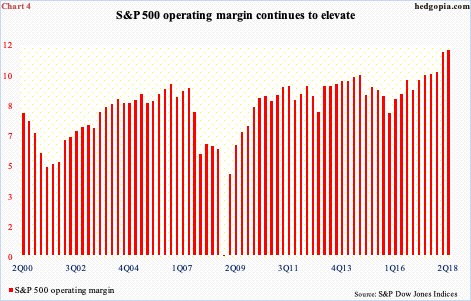
In 2Q18, operating earnings for S&P 500 companies were $38.65, and sales $334.64, for an operating margin of 11.6 percent. This is a big positive. Concurrently, sales growth is accelerating. In 2Q18, sales jumped 11.2 percent over the corresponding quarter last year. In 4Q15, sales were down three percent, before reversing the trend higher.
With that said, sales growth at this breakneck pace is not going to continue. This is way much better than the rate at which the US economy, as well as the global economy, is growing. The same holds true with the margin picture. The fact that it is as strong as it is also raises the odds of a peak/reversal. That is where Chart 4 comes into play. The revision trend in earnings estimates is already down. It is not a hypothetical. Thus far, the S&P 500 has not begun to follow it lower. Historically, it has, hence worth watching.
Thanks for reading!
