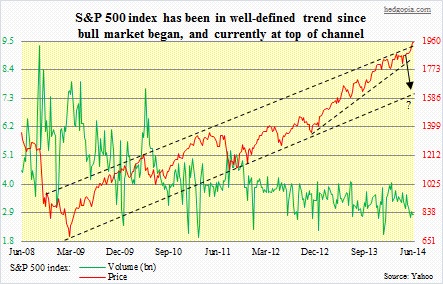
 The S&P 500 acts well. Since it found support at its 150-day moving average early February, it has appreciated 12 percent – that is in four months. In the process, it now has carved out support levels at 1900, 1885 and 1850. Technicals are way overbought, and have been that way for a while now, particularly mid- to long-term; near-term, too, they are screaming for a time-out. Nevertheless, the index has managed to continue to push higher, and is now pushing up against crucial resistance. Since the bull market began early 2009, the index has traded within a well-defined trend channel. With the recent move-up, it is right at/underneath the top end of that channel. A convincing break out of this channel would add further credence to the bulls’ thesis.
What are the odds, though?
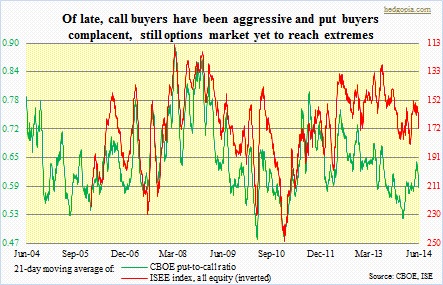 First, short interest remains high. The low-volume levitation the index – and other indices – witnessed the past couple of weeks is probably caused by some level of squeeze. Given the high level of short interest – both NYSE and Nasdaq – there is definitely room for more squeeze, should there be new inflows into stocks. Secondly, in the options market, things are yet to get to extremes. Yes, CBOE’s straight put-to-call ratio the past four sessions has come in at 50 or below, the 21-day moving average is yet to get to the low-50s; the recent low readings (straight) will certainly help suppress the average in the days ahead. Over at the ISE, it is the same message; things can get a little bit more complacent before flashing a cautious sign on equities. So both these metrics point to the possibility that the rally continues.
And then there is this.
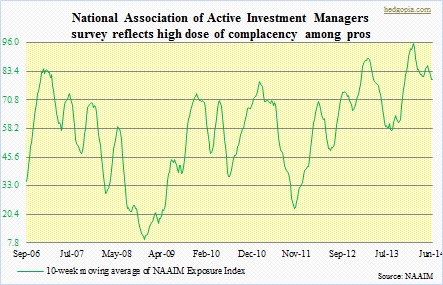
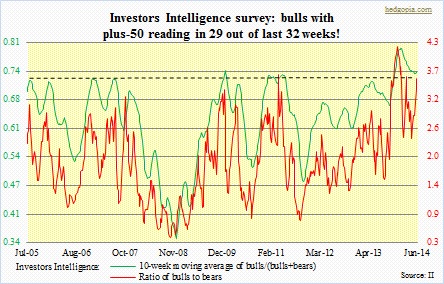 As stated earlier, technicals are way stretched, as is investor psychology. Investors Intelligence bulls registered 62.2 percent last week, and have had plus-50 reading 29 out of the last 32 weeks. In the past, a 0.72-0.74 reading in the 10-week moving average of bulls/(bulls+bears) has consistently been a time to fruitfully get cautious on equities. This time around, this reading has been in the 70s since mid-November last year. This is way too complacent, and shows no fear. This incidentally is also seen in the VIX and the American Association of Individual Investors survey (both not shown here), and in the NAAIM Exposure Index. The latter represents active money managers and shows their overall equity exposure. As is seen in the chart below, numbers are off the charts. This investor-psychology metric – and others – have been flashing yellow/red signal a while now. So this alone probably does not suggest that the SPX has to head south. What is of importance is the fact that the index is near crucial resistance, even as technicals are overbought. These two factors can combine to exert downward pressure near-term. Whether or not that turns into pressure in the medium-term depends on how the index acts at/near the support levels identified above.