
The S&P 500 has been sideways at 5640s the last seven sessions. A likely breakout needs cooperation from tech, which is beginning to lag.
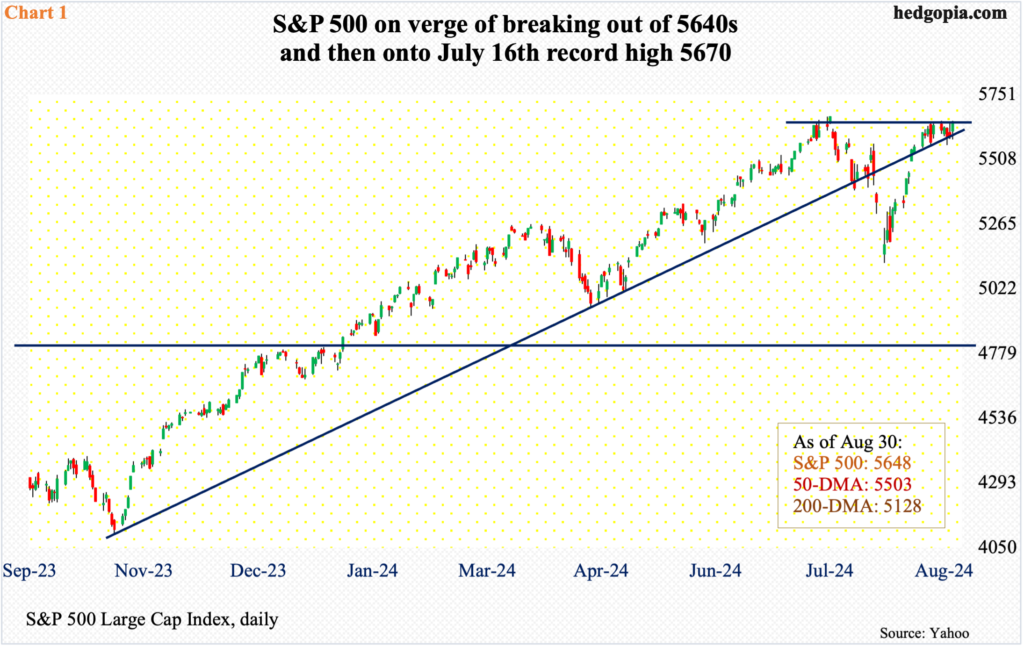
Early last month, the S&P 500 breached a rising trendline from last October’s low. It kept dropping until troughing on the 5th. The trendline was reclaimed mid-month; the support has since been defended, even as the large cap index has struggled to break out of 5640s the last seven sessions. The July 17th gap has now been filled (Chart 1).
The S&P 500 (5648) reached a fresh intraday high of 5670 on July 16th. In all probability, this level gets tested in the sessions ahead. Equity bulls are gearing up for this. At Wednesday’s low last week, the index was down 1.3 percent, but finished the week lower 0.2 percent, forming a dragonfly doji on the weekly.
More important is how investors will react once the July high is tested. As things stand, tech is not cooperating, and without the sector’s help, it is hard to imagine a sustained breakout.
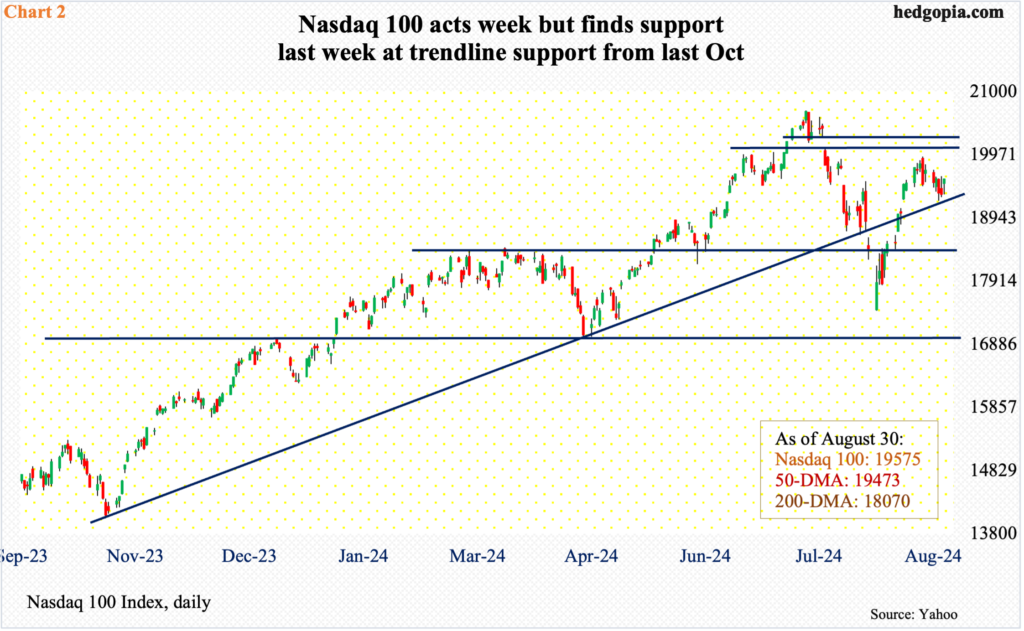
Last week, the Nasdaq 100 shed 0.7 percent to 19575, having peaked at 20691 on July 10th. Unlike the S&P 500 which is within striking distance of its record high, the Nasdaq 100 is 5.7 percent from its.
Last week, the tech-heavy index managed to close above the 50-day (19473) but has essentially straddled the average the last seven sessions. The average is flattish to slightly down; in contrast, the 50-day in the S&P 500 is rising.
Amidst all this, tech bulls did buy weakness at Wednesday’s low last week, when the Nasdaq 100 was down as much as 2.5 percent. The index is also drawing bids just above a rising trendline from last October, which, as was the case with the S&P 500, was breached early last month but reclaimed midway (Chart 2). Last but not the least, the daily RSI last week turned up at the median, finishing the week at 54.57. Leading up to the July peak in the index, the RSI was solidly into the 70s, even touching the low-80s at one point. Momentum is clearly lacking right now.
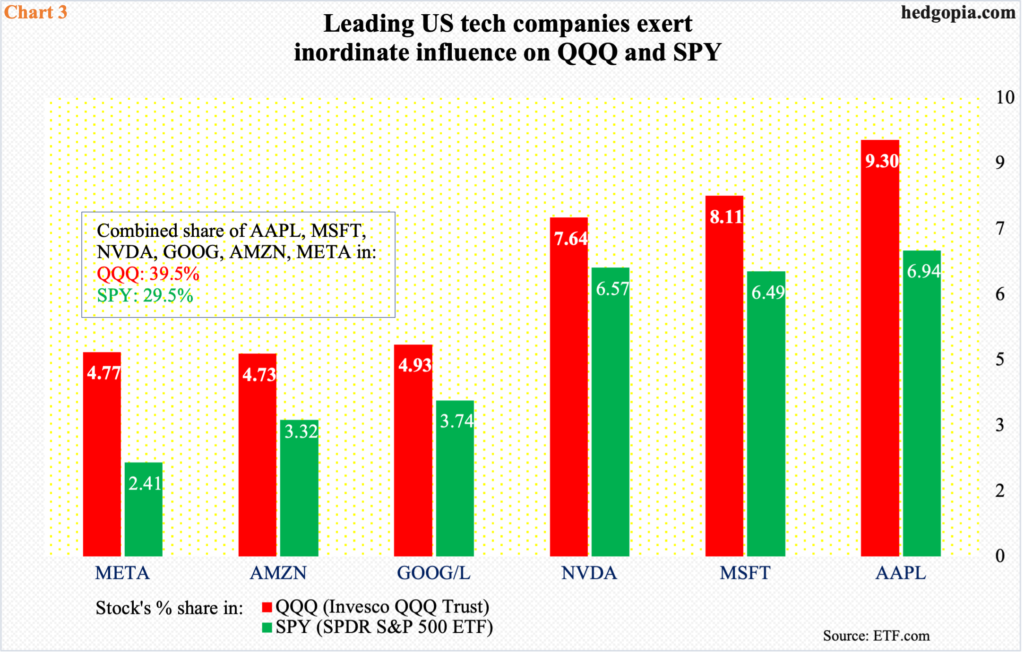
Blame the leading tech stocks, who exert inordinate influence on market cap-weighted indices (Chart 3).
Of the big six – AAPL ($3.5 trillion in market cap), MSFT ($3.1 trillion), NVDA ($2.9 trillion), GOOG ($2 trillion), AMZN ($1.9 trillion) and META ($1.3 trillion) – which together account for 39.5 percent of QQQ (Invesco QQQ Trust) and 29.5 percent of SPY (SPDR S&P 500 ETF) – Apple and Facebook parent Meta are the only ones trading above both the 50- and 200-day, with AAPL 3.6 percent from its July high and META 4.4 percent from its August high. The remaining four are all trapped between the averages and are down a decent amount from their highs, with MSFT 12.3 percent from its July high, GOOG 17.1 percent from its July high, AMZN 12.7 percent from its July high and NVDA 17.9 percent from its June high.
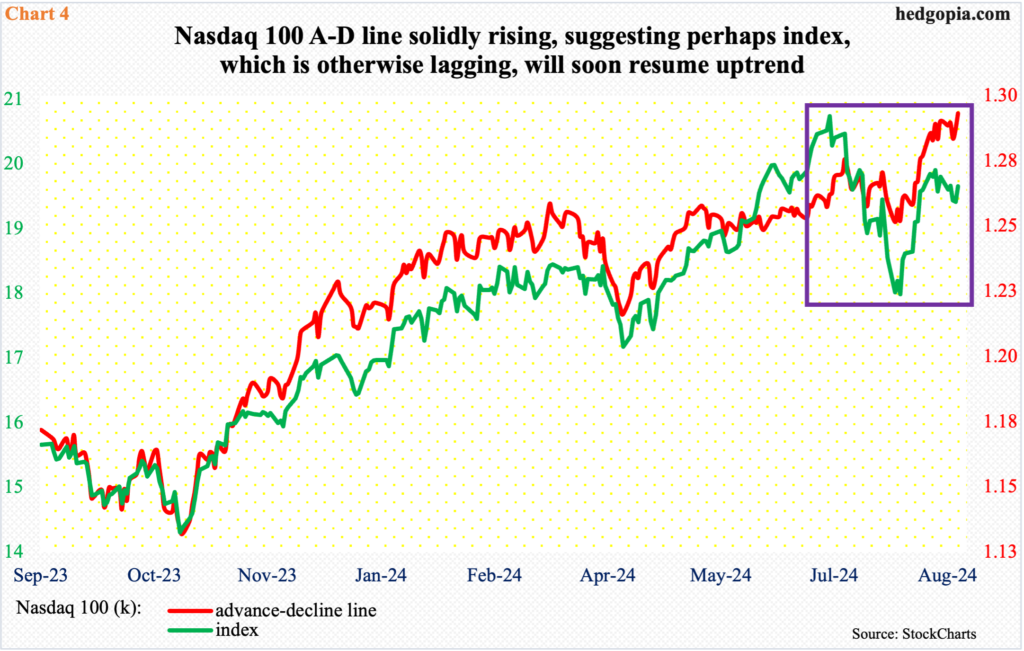
These stocks need to get their act together. Otherwise, underneath this weakness, the Nasdaq 100 advance-decline line acts just fine. The A/D line, which measures if more stocks are rising or falling, is at a new high, diverging with the Nasdaq 100 (Chart 4).
If the index is falling and the A/D line is rising, fewer stocks are dropping, which, more often than not, suggests the index is about to turn around and join the A/D line. This is the best possible scenario for tech bulls right now. If they cannot cash in on this and rally the big weights, then it is just a matter of time before the index breaches the October trendline and the S&P 500 follows suit.
Thanks for reading!
