
The spread between the dividend yield of S&P 500 companies and 10-year Treasury yields has gone negative the last four quarters, albeit not by much. This could exacerbate if – big IF – the White House’s proposed tax cuts pass Congress, which could potentially put upward pressure on rates.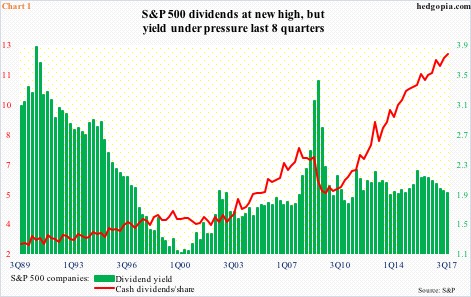
In 3Q17, S&P 500 companies paid $12.31 in dividends (Chart 1). This was a new high and up 8.4 percent year-over-year. Growth has accelerated from the 1Q16 low of 4.6 percent.
Assuming the proposed tax reform passes in its current form and large corporations are allowed to repatriate cash hoarded overseas, dividend distribution might even get a tailwind, at least temporarily.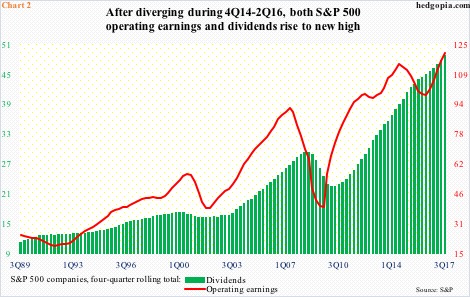
In fact, on a four-quarter rolling total basis, both dividends and operating earnings were at new highs in 3Q17, thereby resolving a preceding brief divergence between the two.
Beginning 4Q14 through 2Q16, operating earnings fell, even as dividends continued rising (Chart 2). Earnings bottomed five quarters ago, followed by a sequential rise in each quarter.
That said, 2Q16 was also the quarter in which dividends’ share of operating earnings peaked at 45.3 percent, with 3Q17 at 40.1 percent (not shown here).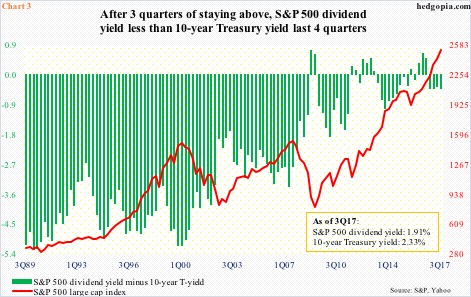
In the meantime, the S&P 500 large cap index continues to make newer highs, and this limits growth in the yield, which stood at 1.91 percent in 3Q17. This was the lowest in 13 quarters.
As things stand, pitted against 10-year T-yields, the dividend yield compares rather poorly. In 3Q17, 10-year yields were 41 basis points higher. Nonetheless, the spread is negligible. But if it continues to rise, stocks will begin to face competition.
Hence the significance of the proposed tax reform.
Wednesday’s blog dealt with the proposal and potential repercussions for interest rates should tax cuts end up raising the government deficit. The nation is already in debt up to its eyeballs, even as the Fed begins to reduce its massive $4.5-trillion balance sheet. If supply/demand dynamics dictate, rates can come under upward pressure.
In this scenario, the green bars in Chart 3 can provide competition to the red line.
Thanks for reading!
