
On September 27, the White House unveiled its proposal for changes to the tax code, which would drop the corporate rate from 35 percent to 20 percent. For individuals, the top tax bracket drops from nearly 40 percent to 35 percent and the bottom rate rises from 10 percent to 12 percent, among others.
Assets are responding.
In the past five sessions, 10-year Treasury yields rose 13 basis points intraday before coming under pressure Tuesday, and the Russell 2000 small cap index jumped 3.8 percent. Small-caps inherently are domestically focused. For the most part, they tend to pay the high federal income tax rate and enjoy fewer tax shelters, hence are perceived beneficiaries.
If the tax proposal goes through Congress and becomes law in its current form, Chart 1 can look a whole lot different.
On an absolute basis, federal personal taxes were $1.59 trillion (at a seasonally adjusted annual rate) in 2Q17 – a new record. But as a share of personal income, they made up 9.7 percent, higher than the 3Q09 low of seven percent but nowhere near record.
It gets even more interesting on the corporate front.
In 2Q17, corporations paid $411.2 billion in federal taxes (SAAR), which amounts to 18.2 percent of profits before tax ex adjustments for inventory and depreciation. The red line in Chart 2 already shows a persistent downward trend over time.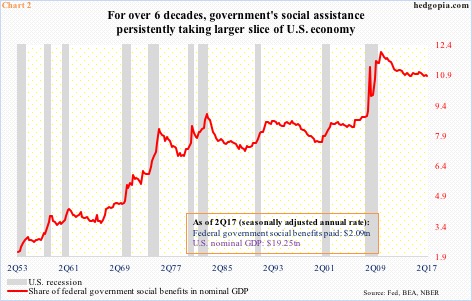
Assuming the proposed tax cuts become law, the federal government will have a juggling act at hand. For one, the decline in revenues will have come at a time when social benefits are under persistent upward pressure.
Chart 2 plots federal social benefits as a percent of nominal GDP. It was 10.9 percent in 2Q17, off the all-time high of 12.1 percent in 1Q10, but back in the ’50s this was in the two-percent range.
This is not taking place at a time when the government is running a surplus.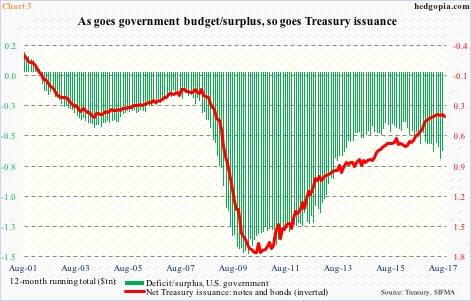
On a 12-month rolling total basis, the last time the U.S. government ran a surplus was in 2002 (Chart 3).
July saw a deficit of $639.7 billion – a substantial improvement from a deficit of $1.4 trillion in February 2010 – but remains massive. Issuance of Treasury notes and bonds closely follows.
In all probability – in its current form – the tax plan leads to an increase in the deficit.
Therein lies the rub. This would have come at a time when the Federal Reserve beginning this month is reducing its massive $4.5-trillion balance sheet – first by $10 billion/month, which then gradually rises to $50 billion/month in the months to come.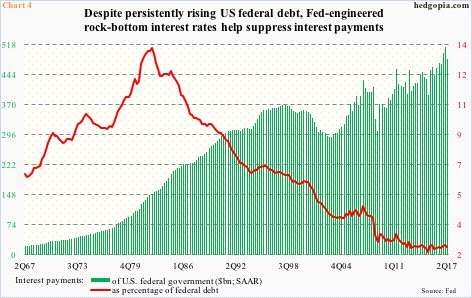
If all this puts upward pressure on rates, then we have a problem.
In 2Q17, the federal government paid $482.3 billion in interest payments (SAAR). At the time, it owed $19.8 trillion in debt. The latest number is $20.2 trillion.
In 2Q17, the government effectively paid 2.43 percent in interest (Chart 4). Thanks to the low interest-rate environment post-financial crisis, interest payments as a share of debt are near all-time lows.
Assuming rates were only 100 basis points higher, 2Q17 interest payments would be $200 billion higher, which would then translate to an even bigger hole in the deficit.
Something is not right with this whole picture.
If Congress views the proposed tax cuts – and its repercussions – this way, a smooth passage is hardly a given, even as small-caps in particular are pricing it in.
Thanks for reading!
