
U.S. productivity continues to leave a lot to be desired, and that can have repercussions for corporate earnings.
Non-farm output per hour grew a mere 0.26 percent year-over-year in the second quarter, down from 0.63 percent sequentially. Quarter-over-quarter, it rose at an annualized rate of 1.3 percent in the quarter – after two straight down quarters. So that is encouraging. At the same time, it is way too soon for high-fives.
Quarterly numbers (reported Tuesday) were revised all the way back to 2010. Output per hour for 2012-2014 was revised downward, though only slightly – 2012 from rise of one percent to 0.93 percent, 2013 from 0.85 percent to flat, and 2014 from 0.71 percent to 0.69 percent.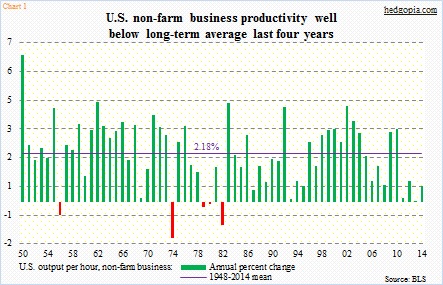
The trend is clearly down. In 2011-2014, productivity only managed to grow an average 0.45 percent. This compares with an average 2.18 percent going all the way back to 1948. The four bars on the right side of Chart 1 look ridiculously small, come to think of it.
The tepid rate of productivity growth is not conducive for economic growth. At the most basic level, the latter is a function of growth in civilian employment and output per hour. Since Great Recession ended, real GDP has only managed to grow at a seasonally adjusted annual rate of 2.1 percent, versus 3.2 percent going all the way back to 1947.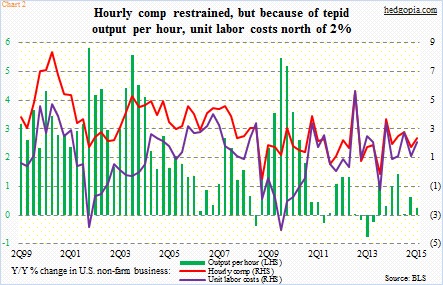
The lack of productivity growth is one reason why wages are as suppressed as they are. In an ideal world, in which productivity is running high, it is much easier for corporate America to give a raise. In 2Q15, for instance, output per hour rose 0.26 percent year-over-year, hourly comp 2.38 percent and unit labor costs 2.11 percent.
Unit labor costs are a function of hourly comp and output per hour. They essentially equal the difference between hourly comp and output per hour. As can be seen in Chart 2, unit labor costs were north of two percent, not because comp growth was skyrocketing but due to suppressed productivity.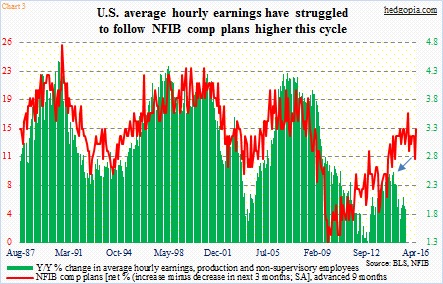
Chart 3 is highly relevant in this regard. It plots the average hourly earnings of U.S. production and non-supervisory employees with National Federation of Independent Business members’ comp plans, with the latter advanced by nine months. The latter tends to lead. Though this cycle has been a little different in at least two respects.
First, since 2000 the red line in the chart has consistently been making lower highs. Second, the green bars began to diverge last August, as earnings peaked at 2.5 percent. Last month, the red line jumped four points to 15. Impending wage pressure, then?
Oddly enough, the red line in Chart 3 has been forecasting wage acceleration for a while now – not a base case on this blog, by the way. It has not happened. The last time the green bars grew with a three handle was back in May 2009.
But let us assume for a moment that wages do indeed begin to pick up speed, how could that potentially impact unit labor costs? They will likely spike, as productivity remains low. In the current cycle, corporations have done a lousy job of investing in the capital stock.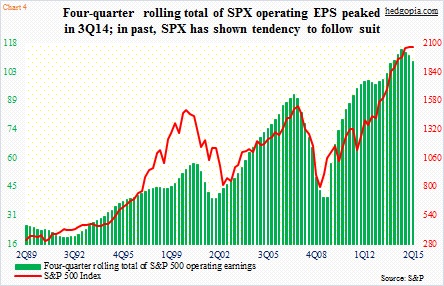
When it is all said and done, this scenario can only adversely impact corporate earnings, which are already in deceleration. The four-quarter rolling total of operating earnings of S&P 500 companies peaked at $114.51 in 3Q14 and by 2Q15 were $6.11 lower (Chart 4). Consensus estimates for 2015 have progressively been revised lower; as of August 10th, they were $112.03 – lower than $113.02 in 2014. The current trend is bad already. If wages pick up, it will be worse. In this scenario, the red line likely will have to sprint to catch up to the green bars, not just jog. Something to worry about medium- to long-term.
Thanks for reading!
