
By now, this is no news. Supply bottlenecks have surged in recent months. In the meantime, the Transports are struggling to match the performance of the S&P 500. If past is prelude, it is healthy when they move in tandem.
This should not come as a surprise given what the world is going through. The adverse impact of Covid-19 on economic activity has been felt globally – magnitude notwithstanding. Nevertheless, Chart 1 does give us a window into how bad things are.
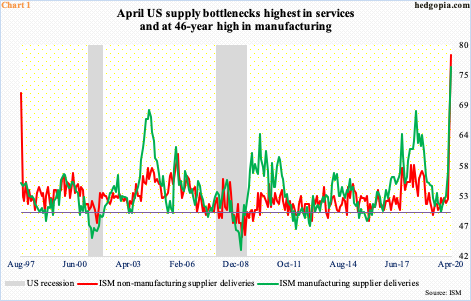
ISM’s ‘supplier deliveries’ sub-index tells us about supply bottlenecks. In April, both services and manufacturing activity froze. The non-manufacturing index jumped 16.2 points month-over-month to the highest ever (Chart 1). Data goes back to July 1997. The manufacturing index increased 11 points m/m to 76, which was the highest since April 1974. This series goes as far back as January 1948.
A reading above 50 indicates slower deliveries, while a reading below 50 indicates faster deliveries. The virus obviously has disrupted the global and domestic supply chains. Plants have been shut down. Suppliers continue to struggle to deliver. And there are transportation challenges.
The Dow Jones Transportation Average is an index of the stock prices of 20 transportation companies, encompassing airlines, railroads, delivery services, trucking, marine, and rental and leasing services.
In a healthy economy, this index should be firing on all cylinders. What is being produced needs to get to the wholesaler to the retailer to the consumer. Even as other major US indices including the S&P 500 Large Cap Index continued to rally into February highs this year, the Transports peaked as far as back as September 2018 at 11623.58.
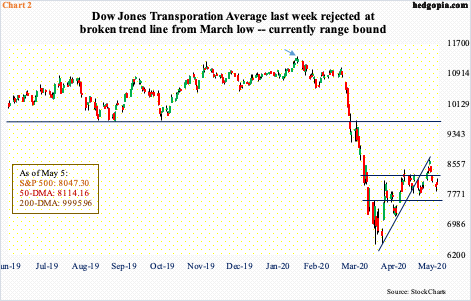
Even this year, the Average peaked in January at 11359.49, although it genuinely came undone after posting 11071.92 on February 20th. This is when other indices peaked. By March 18th, the Transportation Average tagged 6481.20. The rally that followed stopped last Wednesday at 8697.49, which approximated the December 2018 low of 8636.79. This rejection has potential to be significant. Even before this, the Average (8047.30) broke a rising trend line from the March low more than two weeks ago. It is currently range bound between 8250s and 7560s (Chart 2). Risk is to the downside.
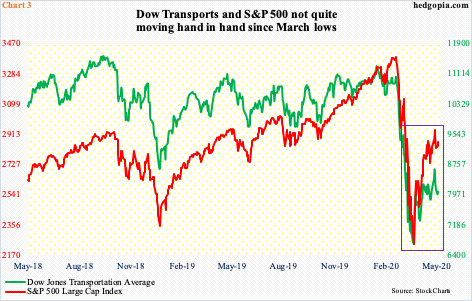
Since the March lows, the Transportation Average has failed to go toe to toe with the S&P 500. In other words, there is a divergence between the two (box in Chart 3). The S&P 500 retraced 61.8 percent of the February-March decline before retreating, while the Transportation Average came up just short of retracing 50 percent.
Ideally, it is better if they moved together. The Transportation Average is also 0.8 percent from the 50-day, even as the S&P 500 is 4.6 percent above the average. The point is, the two are marching to a different tune. Unless the Transportation Average quickly falls in line, this in due course raises the risk that the S&P 500 come under pressure to match the performance of the Transports.
Thanks for reading!
