
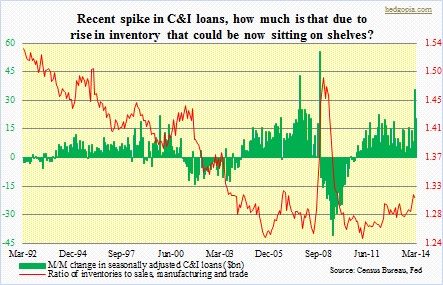
 The release of February’s commercial and industrial loan data ensued a lot of excitement. ‘Finally!’ was the typical reaction. The $36bn increase (to $1.67tn) was the largest month-over-month rise since October 2008. March data just came out, and we learn that banks increased their loan book by another $21bn. Versus February, this represents a deceleration (in growth), but the number is respectable, given how subdued loan activity has been in the current cycle.
So what is going on here? Are banks finally ready to start aggressively lending?
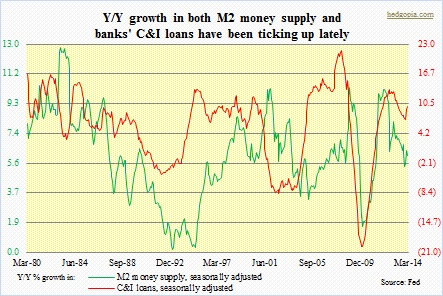 The chart below gives us a perspective into what is happening with C&I loans versus the money supply. Growth in the money supply and C&I loans do tend to track each other, give and take. The correlation coefficient between the data sets – from January 1960 to March 2014 – is 0.18, which by no means suggests perfect correlation, nevertheless it is positive. And lately both have indeed been ticking up.
The recent increase in M2 money supply has come in the wake of consistent deceleration since early 2012, when it was growing in low double digits. As the chart below shows, the velocity of money (M2, in this instance) continues to make new lows. It should be pointed out that this data is as of 4Q13, so given the recent uptick in M2 money supply – both m/m and y/y – it is possible 1Q14 velocity has inched up. We will find out soon. But the fact remains that velocity remains woefully suppressed.
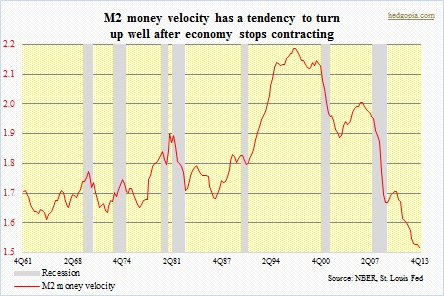 Interestingly, going back at least 50 years, we find out that M2 velocity does have a tendency to stabilize and then turn up well after a recovery is already under way. More often than not, it has taken between two and three years, between peak and trough, before it begins to turn up. The current recovery is already five years old. So from this yardstick, it is overdue – way overdue.
Historically, the taper (tightening) should have resulted in faster velocity. Ditto with tighter spreads, which is the case now. Although, spreads have not tightened because of a pick-up in economic activity, rather due to Fed-engineered risk-on behavior. On the other end of the spectrum, low inflation tends to suppress velocity.
In more ways than one could probably enumerate here, the current business cycle is different from its predecessors – one of which, of course, is Fed’s quantitative easing. One look at the chart below and it is easy to see why. From just under $500bn in early 2009, Fed’s balance sheet has expanded to $4tn. In the meantime, excess reserves of depository institutions swelled from just above $2bn in early September 2008 to $2.6tn now. In essence, a good majority of QE money is sitting idle in the form of excess reserves. 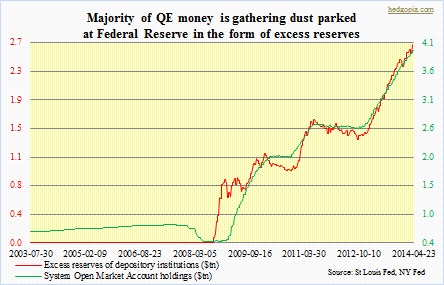
Hence the breakdown in the multiplier effect. These depository institutions need an incentive to lend out their excess reserves. Before October 2008, that would have probably taken place on its own. On October 6 of that year, the Fed announced that it would begin to pay interest on reserves – both required and excess – currently paying 25bps at an annual rate. Because of this, there is no opportunity cost associated with excess reserves.
One can argue that the Fed is essentially paying banks not to lend – or not to lend in an inordinate amount. The former has created so much money that the worry of course is that if all that liquidity finds its way into the economy that could force the inflation genie come out of the bottle.
Personally, I am not convinced the recent spurt in C&I loans is the beginning of a trend. The inventory-to-sales ratio has been inching up. But if it is indeed an indication of things to come, then we should be on the watch-out for inflation worries begin to show some life, and that will have implications for QE and by default stocks.
