
U.S. corporate bond issuance was $106.2 billion in June, comprising $83.1 billion in investment-grade (IG) and $23.1 billion in high-yield (HY).
This puts the first-half total at $868.1 billion, of which $714.1 billion is in IG and $154 billion in HY. At this pace, 2017 is on pace for $1.74 trillion, a new record and versus $1.52 trillion in 2016.
That said, it is probably too soon to reach that conclusion.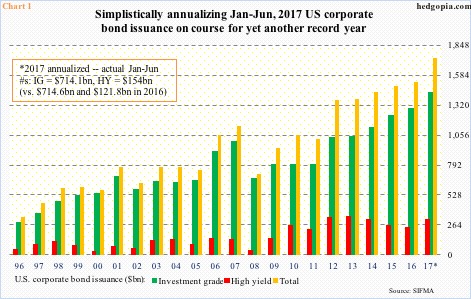
To reach the annualized $1.74 trillion this year, second-half issuance needs to maintain the tempo of the first half – in other words, issue another $868.1 billion. At least going by what transpired last year, this looks unlikely.
In 2016, second-half issuance declined 17.7 percent over the first to $688.1 billion. Simplistically, if 2H this year follows the same pattern, issuance would be $714.4 billion. This would still amount to $1.58 trillion – a new record.
One crucial difference this year is how HY is behaving, which jumped 26.5 percent in 1H over last year. Last year was the third consecutive year HY shrunk (Chart 1). This year, if the 1H momentum carries into the second, this trend will be broken.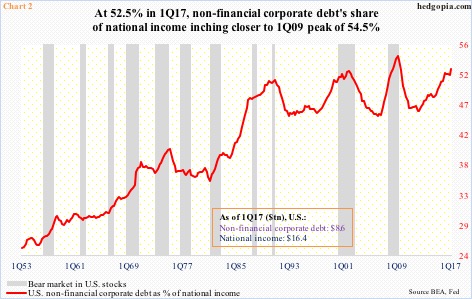
More important, regardless 2017 sets a new record or not, U.S. corporations once again are set to issue boatloads of debt. Since the end of 2008 through last year, bond issuance totaled $10.2 trillion.
In 1Q17, non-financial corporate debt stood at $8.6 trillion, up $2.1 trillion since Great Recession ended in June 2009.
How should we view this debt load? Is it too much, too little, just about right?
Chart 2 shows a share of non-financial corporate debt in national income. In 1Q17, this was 52.5 percent. The all-time high of 54.5 percent was posted in 1Q09. So things are indeed in stretched territory.
Incidentally, the red line in Chart 2 has shown a tendency to peak once a bear market in U.S. stocks is already underway. As things stand, it can continue to inch higher – or we may find out it already has once we learn 2Q17 numbers.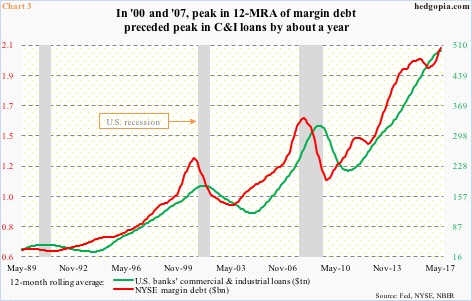
There is a similar message coming from Chart 3, which pits NYSE margin debt with U.S. banks’ commercial & industrial loans. A 12-month rolling average is used. On this basis, both were at new highs in May.
On an absolute basis, C&I loans peaked last November at $2.1 trillion, and has gone flat to ever so slightly down since. Margin debt reached an all-time high of $549.2 billion in April this year, with May down $9.3 billion month-over-month.
Even if April marks the peak in margin debt, it will take time for the red line in Chart 3 to roll over, which, if past is precedent, then gets reflected in the green line. In 2000 and 2007, the latter lagged by about a year. That said, by the time it rolled over, the economy was already in recession.
Hence the significance of Chart 2. As noted earlier, there is room for the red line to continue inching higher, but with each push higher, risk of a reversal would have grown.
Thanks for reading! Please share.
