
- “Markets can remain irrational longer than you can remain solvent”
- Message from several technical indicators not uniformly bearish, but leans that way
- Time to be contrarian? NAAIM members’ exposure to U.S. stocks at 96, vs under 10 mid-October
If U.S. stocks are indeed at a crossroads and if supply begins to overwhelm demand, the next question to ask is this. How long before this supply/demand imbalance sorts itself out? Hopefully some of the indicators we track here on Hedgopia give us some clues. More often than not, depending on how oversold or overbought an indicator is, eventual unwinding can be quite springy.
If you recall, back in the middle of October when the S&P 500 Large Cap Index (2058) was a hair’s breadth away from correcting 10 percent from its then-all-time highs, all the indicators discussed below, as well as others, were in absolute oversold—quite a few of them grossly—territory. They were screaming ‘go long stocks’. Hindsight is always 20/20, but, as it turns out, that would be the right thing to do back then.
The caveat in all this, of course, is that an overbought market, or an index, or a stock, can stay overbought longer than we can imagine, and vice versa. “Markets can remain irrational longer than you can remain solvent,” John Maynard Keynes famously said. That is just the nature of the beast. As a matter of fact, the RSI, just to pick one example, can stay overbought in bull markets and oversold in bear markets for prolonged periods. Buying begets buying. But once the process of reversal gets underway, there can be a stretched rubber band effect.
So what are these indicators trying to tell us now?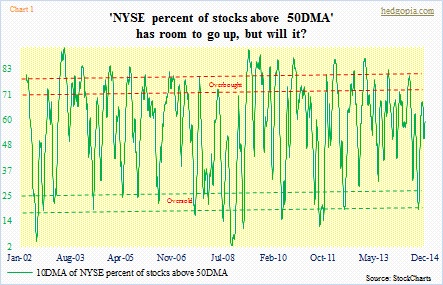
On Friday, less than 57 percent of NYSE stocks were above their respective 50-day moving averages. The 10-day moving average (Chart 1), stood at 59 and is struggling to get into overbought territory. While this could suggest it has room to move higher, there is underlying weakness. The Composite (10831) is a little over two percent off its all-time high reached in September last year. Yet the 10-day average has been making lower highs. The Composite now has a bearish MACD crossover on a monthly chart. And that could mean a shift in momentum is underway.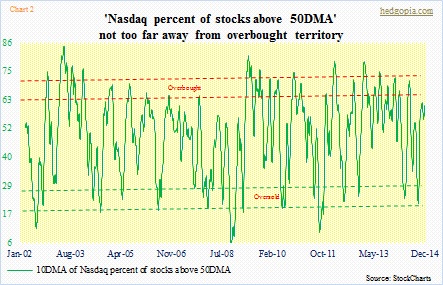
On November 28th, the Nasdaq Composite (4727) made an intra-day high of 4811. Less than a month later, on December 26th, it went on to briefly surpass that high, rising to 4815. The December high is only 300 points away from the all-time intra-day high of 5133 reached in March 2000. The tech-heavy index has come a long way. Yet the advance in price in both November and December was not getting confirmed by the sorely lagging metric in Chart 2. The 10-day average is still rising. Let us see if it can get to overbought territory.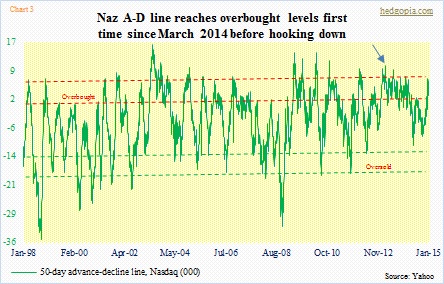
There has been one positive development on the Nasdaq of late. One of the knocks on the Composite has been that even though the index was notching one after another high its advance-decline line was persistently making lower highs. That has been the case ever since the bull market began and particularly since March 2013 (blue arrow on Chart 3). The last time the A-D line entered the overbought zone was March last year. Well, that is no longer the case. The expansion in the line confirms the price move, which is good. Now here is not-so-exciting news. The line is beginning to hook down. Bulls need to act quickly should they want to reverse this. More often than not, once the process is set in motion, it continues lower.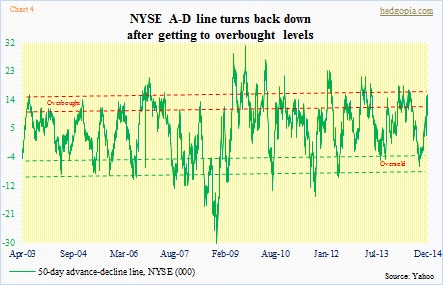
Also on the NYSE, the A-D line is hooking down after reaching overbought levels for the first time since the October 15th trough (Chart 4). If this gets unwound in a typical fashion, this is bound to put stocks under pressure.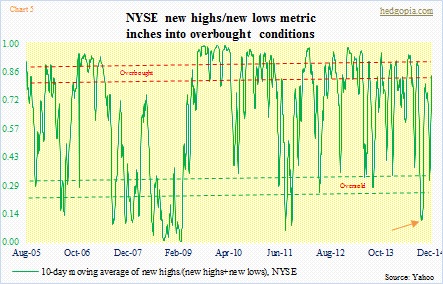
This could soon be at play in Chart 5. The NYSE new high-low index has entered the overbought zone, but is yet to roll over. Notice how oversold it was mid-October (orange arrow).
The Nasdaq is a slightly different story. Its new high-low index is struggling to even get close to the overbought zone. Hence a divergence. While, as pointed out earlier, the A-D line is confirming the Composite’s price action, the new high-low index is not. It is lagging way too much. As a matter of fact, this past November was an all-time monthly close for the Nasdaq. Yet, this is not reflected in the new high-low index.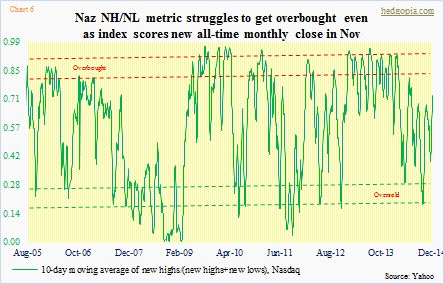
The overall message is this. The signal is not as uniform as it was mid-October. Back then, the only difference was if they were grossly oversold or just oversold. Not so now. Some are overbought, some aren’t. But here is the thing. Even those that are yet to push into overbought levels are diverging from price. And this is definitely something that can feed on itself.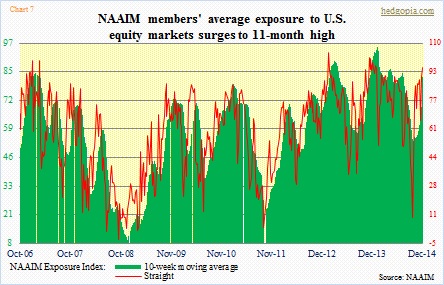
This is particularly so considering that by the end of 2014 NAAIM (National Association of Active Investment Managers) members were already exposed to U.S. stocks up to the gills. On the last day of the year, the NAAIM Exposure Index printed just under 96, 30 points higher in just two weeks (Chart 7). (Not to mention the gargantuan flows into U.S. stocks in the week ended Christmas Eve.) Rather revealingly, mid-October, when there was blood on the Street, they had cut exposure to just under 10. For a contrarian, that was the time to get in, as might be the time to at least cut back right now.
