
- As oil price buckles, increase in talk of need to focus on S&P 500 earnings ex-energy
- Collapse in energy earnings important factor, but SPX ests were too rosy to begin with
- Sell-side struggles to wrap arms around energy repercussions; hard to trust ‘15 estimates
The 4Q14 earnings season is not even one-fifth of the way through, and people are already looking for a scapegoat. With 18 percent of S&P 500 companies having reported so far (as of last Friday), the report card is a dismal 0.3 percent increase (Chart 2). A disappointment versus what was expected when the quarter began – growth of 8.3 percent (Chart 1).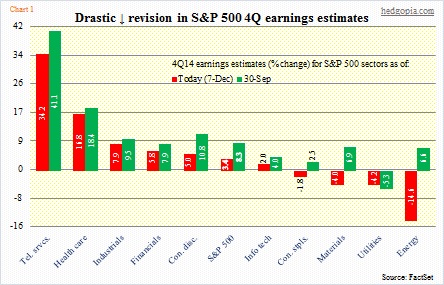
A trend is beginning to emerge. We are now beginning to hear people talk about the need to consider S&P 500 earnings ex-energy. Yep! Since energy is the sector that is hurting the earnings picture the most, so why even bother? To get a clean picture, ex-energy is the way to go. That is the line of thinking. But the logic is based on false premises.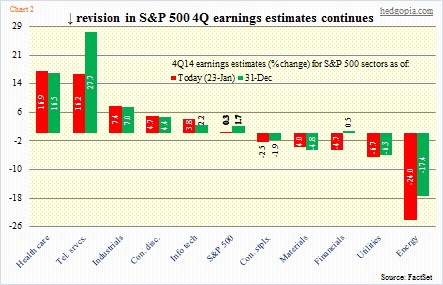
First of all, this was precisely what we used to hear back in 2000-2001 and 2007-2008. Once the tech bubble burst, we were urged to look at earnings ex-tech. And once the housing bubble burst, we were told ex-financials would present a cleaner picture. Now we know that would have been a wrong thing to do.
Secondly, what is going on in energy is not a one-quarter phenomenon. It is going to be a trend. The only question is duration. Any time an important commodity like oil drops by more than half in six months, repercussions are bound to be more than one-off.
Thirdly, the energy sector is no chump change from the viewpoint of the overall S&P 500 index. In 3Q14, it made up 13.9 percent of the index’s total sales, second only to consumer discretionary’s 14.6 percent (courtesy of S&P). The sector contributed 12.3 percent to total operating earnings.
As fast as the price of oil has dropped, the sell-side is struggling to wrap its hands around the problem. Look at Chart 1. At the end of 3Q last year, the West Texas Intermediate crude fetched $91/barrel; the sell side expected the energy sector to grow 4Q14 earnings 6.6 percent. Fast forward to December 7, oil was at $66, and earnings estimates had dropped to -14.6 percent. A month and a half later (as of January 23), oil traded at $45, and bottom-up estimates for the sector had crashed to -24 percent (Chart 2).
Here is the irony. Fine, energy is down. And we know why. But why are estimates for telecom services lower than what they were at end-3Q14? Back then, telecom services were expected to grow 4Q earnings by a whopping 41.1 percent (Chart 1). Now they are down to increase of 16.2 percent (Chart 2). Or for that matter, take financials, which has swung from an expected increase of 7.9 percent to a decrease of 4.7 percent (a 12.6 percent swing!). Yes, energy is taking a toll. But there is a bigger problem – lofty expectations. Simply put, unrealistic dreams are being cut down to size.
This is not some recent phenomenon.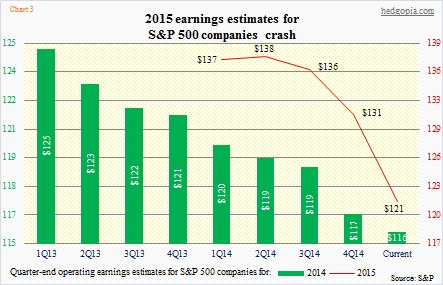
The sell-side has a tendency to see things through a pair of rose-colored glasses. They are an optimistic bunch. At times unrealistically. The gullible retail falls for it. Back in 1Q13, they were expecting $124.73 in operating earnings for S&P 500 companies in 2014 (green bars in Chart 3). Guess what? As 2014 got closer and closer, the bars got smaller and smaller. Now, 2014 is expected to come in at $115.77, up from $107.30 in 2013, for growth of 7.9 percent – healthy growth, except it is nowhere near the 16-percent-plus growth expected at 1Q13.
Notice a similar trend for 2015. As early as 2Q14, operating earnings this year were expected to come in at $137.52, which has now been right-sized to $121.31. If 2015 estimates are met, earnings would have grown 4.8 percent over 2014. Decent, but growth would have decelerated substantially from 2014. Even more important, should we even trust this number?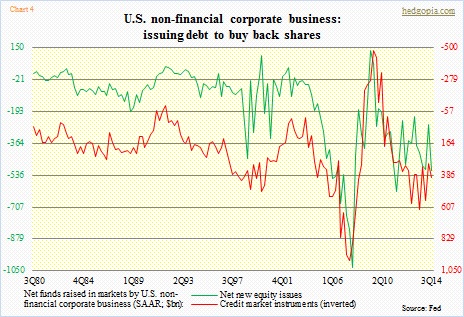
First of all, once again, let us look at the trend and revisit Charts 1 and 2. In (1), estimates were revised downward for all the 10 sectors. Energy, of course, was the biggest culprit, but no sector was spared. In (2), things are a little different. To be clear, versus what was expected at end-September, estimates are still down across the board. But versus what was expected at end-December, there is stability in some sectors, with health care, industrials, consumer discretionary, and information technology slightly better than three weeks ago. Nonetheless, energy remains the big known unknown.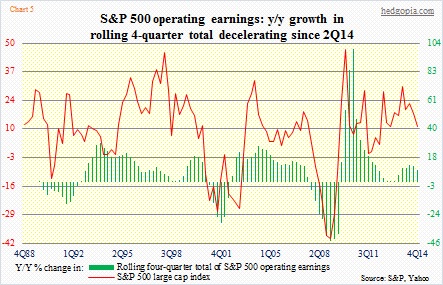
Secondly, corporate buybacks have been an important factor in all this (Chart 4). In 3Q14, non-financial corporates bought back $512bn worth of equities, and issued $404bn in credit market instruments (which includes commercial paper and corporate bonds, among others). Particularly in a hard-hit sector such as energy, this is not going to continue.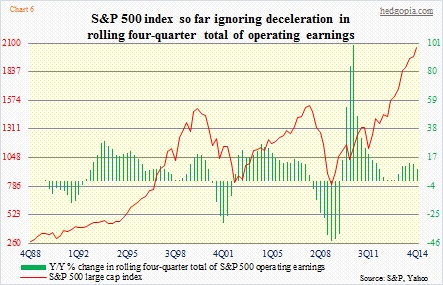
Combine that with a decelerating earnings-growth picture, what risks do investors face? Chart 5 seeks to provide a clue. Year-over-year growth in the rolling four-quarter total of S&P 500 operating earnings peaked at 12.6 percent. If 4Q earnings come in as expected, they would have grown 8.7 percent. As the chart shows, both the red line and the green bars tend to track each other. Separately, back in 2000 the S&P 500 index started dropping as the four-quarter rolling total peaked (Chart 6). In 2007, the index peaked only after the green bars went negative. In 1Q13, growth in earnings dropped to 0.23 percent. But by that time, QE was in full swing, coupled with aggressive corporate buybacks.
At least for now, the Fed is out of the picture, and buybacks will probably slow down, with decelerating earnings. Not a nice combo.

John Monter
Very well thought-through assessment, Paban. Based on the market’s recent turmoil, it appears that the bloom is coming off the rose.
Keep uup the good work!