
The advance report on durable goods for September was reported this morning, and the disappointing trend continued.
Orders for non-defense capital goods ex-aircraft – a proxy for business capital expenditures – were $68.6 billion, down 0.3 percent month-over-month and down 7.3 percent year-over-year (Chart 1). This was the eighth consecutive annual declines. The September drop was the largest since November 2009.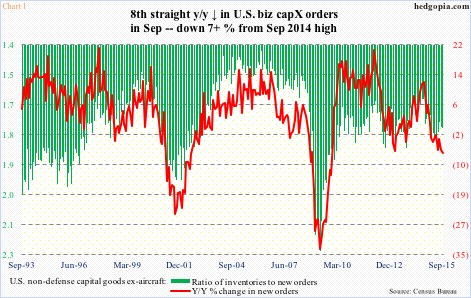
Orders peaked at $74 billion a year ago, and remained in the $70-$71 billion range until January. It will be a while before we see an annual increase.
The trend is not going the right direction. August orders, for instance, were progressively revised lower from $69.8 billion to $69.3 billion to $68.8 billion.
The silver lining in all this in what is happening in inventory, which is no longer rising. September was $120.3 billion. August has been revised downward from $120.7 billion to $120.5 billion to $120.3 billion. Inventory peaked at $121.9 billion in April.
With that said, inventory remains high, reflected in the ratio of inventories to new orders in Chart 1.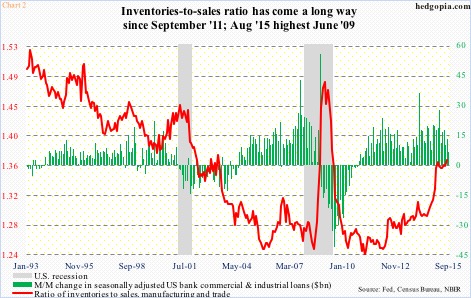
The level of inventory accumulation that has gone on in the economy is even better highlighted in Chart 2.
In August, manufacturing and trade inventories were $1.81 trillion, versus sales of $1.32 trillion. As U.S. banks’ commercial & industrial loans picked up, so did the red line. The ratio of inventories to sales began to surge particularly since July last year. The August reading 1.371 was the highest since 1.385 in June 2009.
All this does is take away from growth in future months and quarters. That is no help to the red line in Chart 1.
Thanks for reading!
