
- U.S. consumer confidence has surged since July 2014
- Decent inverse correlation between gas price and consumer sentiment
- No correlation between personal consumption expenditures and consumer sentiment
Consumer confidence is soaring in the U.S. Since July 2014, the Thomson Reuters/University of Michigan consumer sentiment index has jumped nearly 17 points to 98.1 – highest since January 2004. Higher than pre-Great Recession (back then, began to crater after hitting 90.4 in July 2007). The highest reading (112) was recorded in January 2000 – right before the dot com bubble burst. Depending on one’s point of view, this can be viewed as both positive (there is room for it go higher, as the 2000 high has not been matched yet) or negative (this is as good as it gets, as we know what followed the relatively high 2007 reading).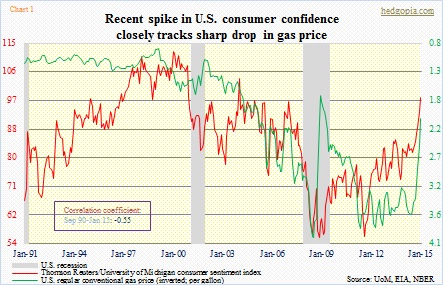
One thing we can notice looking at Chart 1 is that there is a decent correlation between the price of gas and consumer sentiment. Makes sense. Crude oil peaked in June last year. The price of regular gas was already trending lower (in kind of a saw-tooth pattern), but since mid-year, keeping up with the drop in crude, it went vertical. Since June last year, it has dropped $1.58 – 44 percent – to $2.05/gallon (as of January). The correlation obviously is inverse (-0.55). As gas price goes lower, sentiment improves.
This much makes sense. The drop in gas price is a clear windfall for consumers. They are not spending as much as they used to, so they have few extra dollars that they can save, spend on other items, use paying down debt, whatever. Late December, AAA put the amount of money U.S. consumers stand to save this year if prices remain low at $50-$75bn.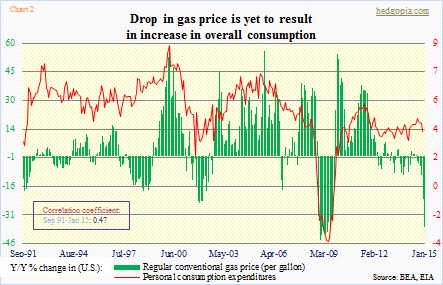
What does not make sense, or is very counterintuitive, is Chart 2.
In it, gas price is plotted against personal consumption expenditures, which is nearly two-thirds of the GDP. Unlike what conventional wisdom tells us, the red line and the green bars do not move inversely to each other. They rather track each other, which incidentally was not always the case. In the months leading up to 2000, a drop in gas price did result in higher growth rate in PCE. No longer.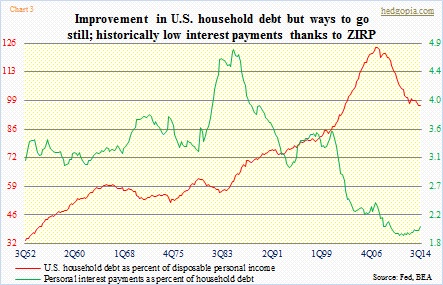
U.S. household debt (home mortgages and consumer debt) has come down from $13.3tn in 2Q08 to $12.6tn in 3Q14, but remains relatively high. 3Q14 household debt as a percent of disposable personal income of 97 percent looks good versus 124 percent in 4Q07, but still compares poorly to a 62-year mean of 71 percent (Chart 3). As the green line shows, they have already benefited from lower interest payments thanks to the Fed’s zero interest-rate policy (2.1 percent in 3Q14). So looking at Chart 2, a good portion of the gas savings is being socked away. Who can blame them? The personal savings rate in December was 4.9 percent, versus a 55-year average of 8.4 percent.
