
- Growth rate of U.S. exports decelerating since 2Q14
- At north of 13 percent, exports’ share of GDP remains very high
- Surging $ no good news for exports; some signs of fatigue, but buck’s momentum intact
The advance estimate of real GDP growth for 4Q14 failed to meet expectations, to say the least. The 2.6-percent print was below consensus expectations of 3-3.3 percent as well as decelerated from the one-off five-percent clip in 3Q14. Personal consumption expenditures contributed 2.9 percent to GDP growth, private investment 1.2 percent. Dragging the GDP down was government spending which subtracted 0.4 percent while net exports cut back one percent.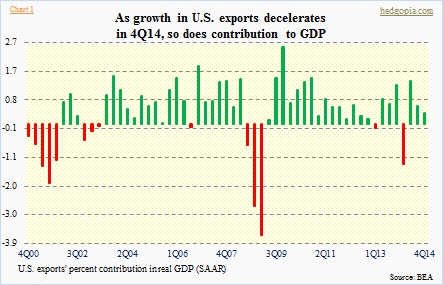
Export growth is in clear deceleration mode. In 2Q14, exports grew 11.1 percent, followed by 4.5 percent in 3Q14 and 2.5 percent in 4Q14; its contribution to GDP growth decelerated from 1.43 percent to 0.61 percent to 0.37 percent, respectively (Chart 1). A trend is developing here. This perfectly jibes with the collapse in the Baltic Dry Index (Chart 2), and with weak economic activity overseas. A relevant data point came out over the weekend. China’s January imports tumbled 19.9 percent year-over-year and exports 3.3 percent – both were much worse than expected.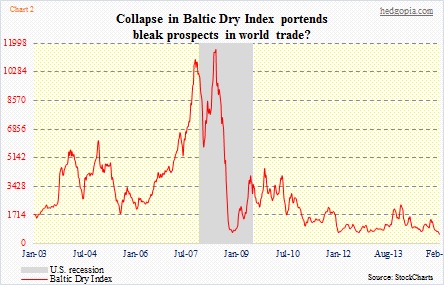
The slowdown in U.S. exports does run in contrast with what is going on in the jobs front in the U.S. This past Friday, literally everywhere you look, people were gushing over how many non-farm jobs were cumulatively created in November through January. The three-month total was the highest since November 1997. But you look under the hood, once again, some deceleration could be noticed. The 400k-plus November total was massive. No question. But both December and January dropped 22 percent each month-over-month. It helps to put things in perspective.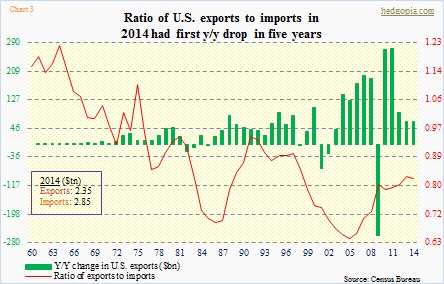
Since the low in 2009, both U.S. exports and imports have recovered nicely. They are up 48 percent and 45 percent, respectively, to $2.35tn and $2.85tn in 2014. In the case of exports, as it grew, y/y growth has been decelerating (green bars in Chart 3), which is not that unusual. Each year, numbers are getting larger, so it gets difficult to repeat the prior year’s growth rate.
From this perspective, the ratio of exports to imports has been rising since the 2005 low. The U.S. trade deficit has dropped from $762bn in 2006 to $505bn in 2014. The ratio fell last year, and that was the first drop since 2010. And it is worth a close watch.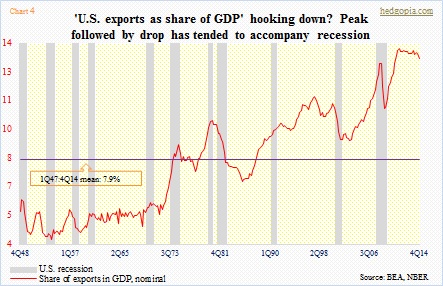
Over the years, exports’ role in the U.S. economy has consistently grown. Going back to 1947, it averaged 7.9 percent of GDP (Chart 4). In 4Q14, it was 13.2 percent. Exports’ share has been under pressure since 3Q11, when it peaked at 13.7 percent. Incidentally, the U.S. dollar index bottomed at 73.9 in July that year (a higher low following the 71.8 low in March 2008, as can be seen in Chart 5). The index started surging last July – now up 19 percent in eight months. In 4Q13, exports amounted to 13.6 percent of GDP; four quarters later, that had dropped to 13.2 percent. The rather-sharp hook lower can be seen on the right side of Chart 4. Going back to post-WWII, a sustained move lower in ‘exports’ share of GDP’ has been coincident with recession.
The dollar’s role in all this is all too obvious.
Multinationals ranging from IBM to DD to PG to MSFT to JNJ to CAT recently told us that the strong dollar was beginning to adversely impact their overseas results. From the Bank of Japan to the European Central Bank, central banks’ new mantra is competitive devaluation. China could be next. Here at home, Fed officials continue to drop hints that a rate hike is imminent this year. The divergence in policy is reflected in the dollar index.
It is a no-brainer.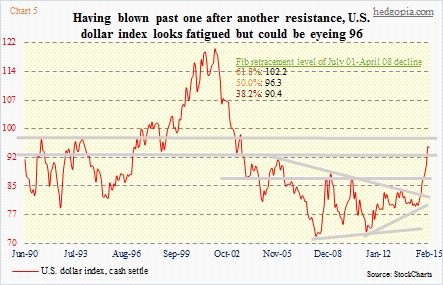
Where the dollar goes from here will have huge repercussions for U.S. exports, which, we are now finding out, are already hurt. There are some signs that the dollar is showing signs of fatigue. But momentum is yet to break. The unfolding Greece saga probably does not help the euro. Since it started going parabolic in July last year, the dollar index has taken out three important resistance levels, one of which includes the 38-percent Fibonacci retracement of the July 2001-April 2008 decline. Fifty-percent retracement lies at 96.3 which approximates the next resistance. If dollar bulls stay put until that level is at least tested, it is more bad news for U.S. exports.
The dollar needs to behave for that red line in Chart 4 not to deteriorate further.
