Relatively speaking, U.S. housing is going strong, with price being the major risk.
Monthly data tend to be volatile. At a seasonally adjusted annual rate in August, sales of existing homes dropped 4.8 percent month-over-month to 5.31 million units, even as sales of new homes rose 5.7 percent to 552,000. The latter was the highest since 593,000 in February 2008, while July’s 5.58 million in the former was the highest since 5.79 million in February 2007.
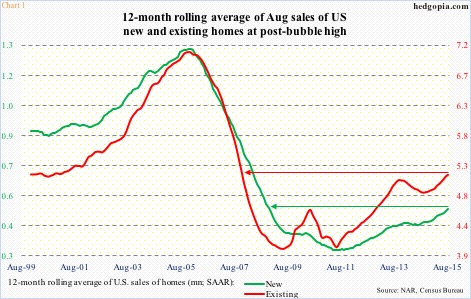
Momentum has been building for about a year, give and take. On a 12-month rolling average basis, sales in both categories are at recovery highs. New homes were 499,000 in August – highest since 502,000 in November 2008 – while existing homes were 5.17 million – highest since 5.21 million in November 2007 (Chart 1).
Rock-bottom mortgage rates have helped. Going back to December last year, only once – in July – did the 30-year fixed mortgage rate rise over four percent. August was 3.91 percent. Given the state of the economy – both here at home and abroad – it is hard to imagine rates staying north of four percent for an extended period.
Despite all the hand-wringing over a potential increase in the fed funds rate, if the Fed does indeed hike this year – not a base case on this blog – it is probable the long end of the yield curve, which is what matters for the majority of mortgages, gets bid up (yields head lower). In this scenario, the interest-rate tailwind for housing is not going away.
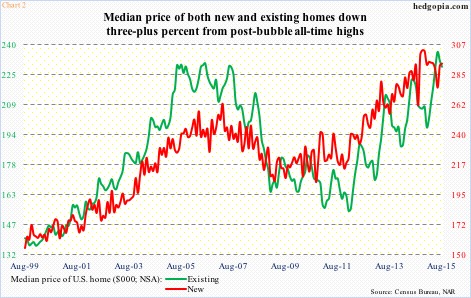
If there is one thing that could scuttle the momentum, it is the price, where the rate of increase has substantially exceeded that of sales. The median price of an existing home made an all-time high of $236,300 this June, while the price of a new home peaked at $302,700 last November (Chart 2). In August, prices in both categories were three-plus percent off the highs – $228,700 (existing) and $292,700 (new).
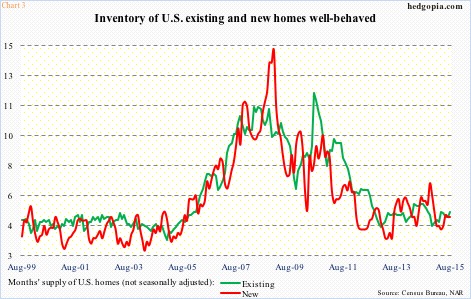
Supply-demand dynamics have been favorable. Months’ supply is well-behaved – 5.2 in existing and 4.9 in new (Chart 3). The metric is based off of the current rate of sales, hence if sales soften it can quickly spike. As recently as November last year, months’ supply of new homes was 6.8. With that said, compared to where things were, inventory is not that out of whack with sales.
This has to be putting upward pressure on the price.
As mentioned earlier, the median price of a new home peaked last November, followed by a peak in the three-month average of sales in February at 520,000, before dropping to 496,000 in June; August was 513,000. On the existing front, the median price only peaked in June, with the three-month average of sales still going strong. July and August were 5.46 million – the highest since 5.51 million in April 2007. It remains to be seen if the 20-percent spike in price between January and June will end up impacting sales of existing homes going forward.
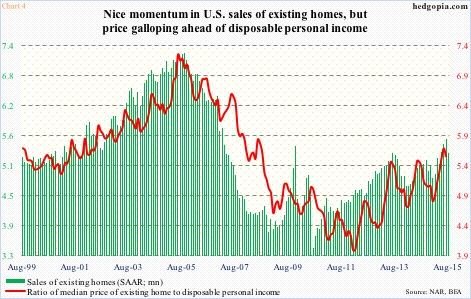
Because of the rapid increase in price, the ratio of median price to disposable personal income has persistently risen particularly since January – from 4.81 to 5.69 in June, highest since 5.78 in July last year. July was 5.56 (Chart 4). In the past, the red line and the green bars have shown a tendency to follow each other. So it is worth a watch.
How is all this dynamic being reflected in housing stocks? ITB ($27.21), the iShares Home Construction ETF, broke out of resistance at $26 in February, which has since been tested several times, including the August 24th intra-day collapse to $23.50. Yesterday, the ETF dropped to $26.61 before staging a reversal. This is important support, and likely holds – at least near-term. Daily momentum indicators are trying to stabilize. Once that happens, there might be opportunities to sell weekly cash-secured puts – just to generate income. Wait-and-watch for now.
Thanks for reading!

