
At the start of the year, real GDP in the U.S. was expected to grow at three percent or better this year. Actual numbers are falling short – substantially. In the first three quarters, growth has been on a sub-two-percent pace.
This has been a familiar pattern in the current recovery.
Going into the new year, expectations are lofty, and they get revised down as the year progresses. Post-Great Recession, real GDP has averaged 2.2-percent growth, versus an average of 3.2 percent going back to 2Q47.
One of the negative effects of this is felt by inventory, which gets built but does not get consumed as growth falls short.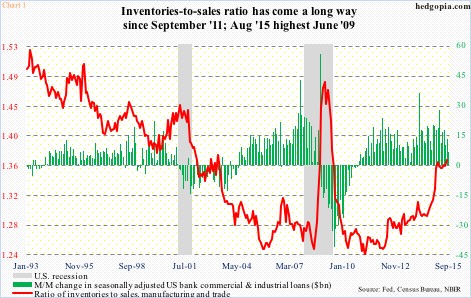
The red line in Chart 1 vividly illustrates this. The ratio of inventories to sales (manufacturing and trade) bottomed at 1.24 in March 2011, and began to nudge higher – normal given the economy was gradually recovering. This was reflected in banks’ commercial & industrial loans. Then two years ago, the green bars in the chart began to spike, followed by a parabolic rise in the red line beginning July last year.
This obviously takes away from future growth, and we are seeing that.
In 3Q15, real private-sector inventories declined by an annualized $56.7 billion. Real GDP grew at 1.5 percent annualized (first print), following growth of 0.6 percent and 3.9 percent in the first two quarters, respectively. The change in inventories in 3Q15 subtracted 1.44 percent from real GDP growth (Chart 2). The price an economy pays when there is too much stuff sitting on the shelves.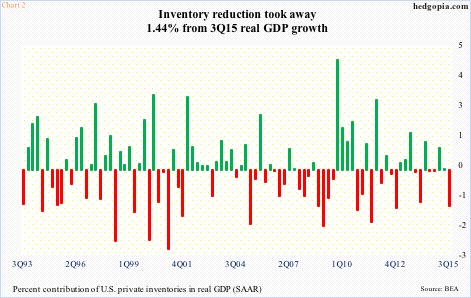
As long as this is the case, there is no need to order.
Orders for durable goods peaked at $299.9 billion annualized in July last year, dropping to $231.2 billion in September (not shown here). Chart 3 specifically looks at orders for non-defense capital goods ex-aircraft – a proxy for business capital expenditures – and portrays the same trend. Orders were $74 billion in September last year, and contracted to $68.8 billion one year later. Year-over-year, orders have now declined for eight consecutive months. The seven-percent contraction in September was the largest since November 2009.
Chart 3 also shows the inventories-to-orders ratio, represented by the green bars, which are beginning to diverge from the red line. A ray of hope?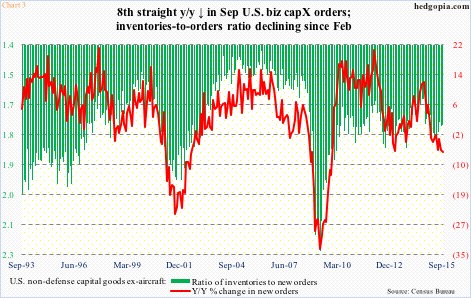
First of all, inventories remain elevated, there is no question about that. With that said, there has been some improvement recently.
Inventories (not shown here) peaked at $121.9 billion in April this year, and were $2 billion smaller in September. Importantly, revision trends have been to the downside – September was revised lower from $120.3 billion to $119.8 billion, August from $120.3 billion to $120.2 billion, July from $121 billion to $120.9 billion, June from $121.5 billion to $121.4 billion, and May from $121.6 billion to $121.3 billion.
In the meantime, the past couple of months in particular orders have been revised higher – September from $68.6 billion to $68.8 billion and August from $68.8 billion to $68.9 billion. This has resulted in the green bars in Chart 3 shrinking from 1.8 in February this year to 1.74 in September.
It seems inventory is being worked off.
The ISM manufacturing’s inventory index has stayed beneath 50 for the past four months. October was 46.5 – the lowest since January 2014. Non-manufacturing is faring a little better, with inventory ticking up from 51 to 52.5 in October; with that said, it was 57 as early as July. Manufacturing inventory was 53 in June.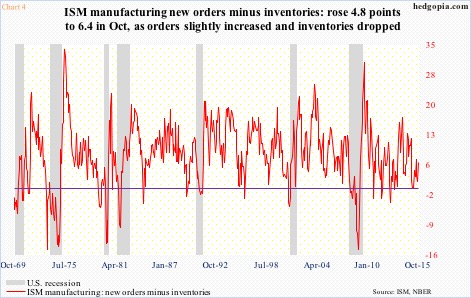
The inventory contraction has helped the red line in Chart 4 continue to stay above parity, since orders have been coming up short. Manufacturing orders grew from 50.1 in September to 52.9, but were down from 56.5 in July and 63 last October.
The point in all this is that given the drop in orders, the inventory situation could have been worse. But both Charts 2 and 3 show some stability. This is not because sales have picked up. They have not. Only 45 percent of the S&P 500 companies that have so far reported their third quarter have beaten on the top line.
Using this logic, the pace of inventory accumulation is softening – the reason why it subtracted from real GDP in 3Q15. A positive development given how elevated it already is.
In this respect, the red line in Chart 1 is worth watching. Inventories and sales are as of August. The ratio surged from 1.293 in July last year to 1.371 this August – the highest since June 2009. September’s numbers will be published on the 13th. Going by what transpired with inventory in 3Q15 (GDP report), the red line likely has stopped going higher. Already it is nearing levels that in the past have been associated with recession. It needs to stop going up.
Thanks for reading!
