
- Ratio of personal interest income to payments declines for three years now
- Persistent rise in number of 65 years and over who are employed
- Suppressed rates past six years no good news for seniors
In his inaugural blog post on Tuesday, followed by another yesterday, Ben Bernanke, former Fed chair, seeks to tackle, among others, an issue that has stirred quite a debate among Fed watchers, economists, investors as well as observers. Who exactly benefits/has benefited from zero interest-rate policy, or for that matter, quantitative easing?
It is not an easy question to answer. If back in the throes of the 2007-08 financial crisis the Fed did not step in and bring the Administration and Congress along, we would probably be looking at a much worse global financial mess. Leverage was very high and business/consumer confidence was shaken. The Fed did what it had to do. It was the right thing to do.
But then, did it overstay its welcome?
Six years into recovery, rates are still zero bound. Too much sugar can leave a bad taste in the mouth, as the saying goes. How much of the persistent stimulation the Fed has provided has filtered through to the economy? Real wages the past seven months are more or less flat – up a tad. People opting out of the labor force has surged. There are more than 46 million Americans collecting food stamps. Main Street has been given short shrift. That is one argument.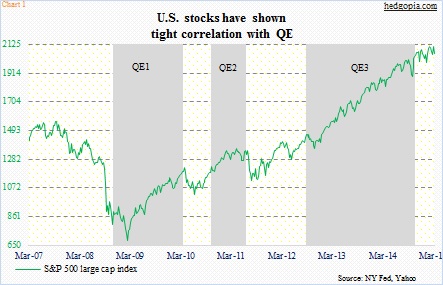
Wall Street, on the other hand, could not have asked for more. Chart 1 shows how well U.S. stocks have tracked QE. Ditto with corporate profits – $2.09 trillion in 2014, down 0.8 percent from a record $2.1 trillion the year before.
This dichotomy has provided fodder for critics to rightly argue that the benefit of the Fed’s policy has been uneven.
On his blog, Mr. Bernanke brought up the issue of seniors. Because they live off of savings, suppressed interest rates are no good news for this group, especially because rates have stayed low for as long as they have.
We can see it in the numbers.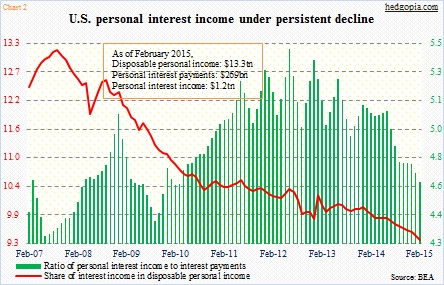
Chart 2 pits personal interest income ($1.2 trillion at a seasonally adjusted annual rate in February) and interest payments ($169 billion) with disposable personal income ($13.3 trillion). Since September 2007, the share of interest income in disposable personal income has persistently declined. The green bars, which is the ratio of interest income to interest payments, has been declining for nearly three years now.
How might the seniors be coping with it?
The next two charts clue us in.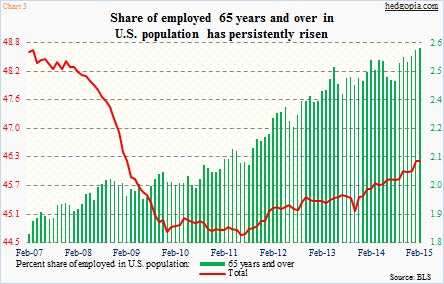
Chart 3 looks at the percent share of employed in U.S. population – 65 years and over versus total. In February, U.S. population was 320.6 million; 148.3 million Americans were employed (household survey), of which 8.3 million were 65 years and over.
In the midst of Great recession, the red line (Chart 3) nosedives. The green bars never do; in fact, they consistently move from lower left to upper right. Throughout the recession and beyond, those 65 years and over have taken a bigger share of jobs out there. The latter point is better depicted in Chart 4. In February, this group made up 5.6 percent of the total employed population out there, nearly two percentage points higher than in the early months of 2007.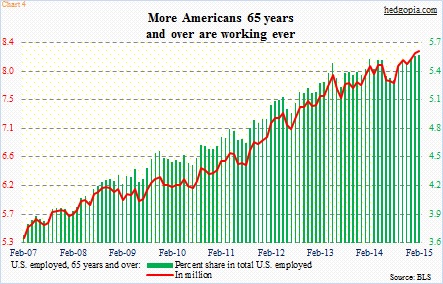
Is this solely due to lower income caused by lower interest income? Probably not. But this has to be an important factor. For some reason, more of them than ever are staying in the workforce, delaying retirement, etc. If they could, they would rather be on the beach somewhere, one would imagine.
