
- June U.S. auto sales 17.1mn units, preceded by cycle high of 17.7mn in May
- Auto loans nearing $1tn; sharp rise since 3Q10; non-revolving consumer credit $2.5tn
- Potential problems in autos: extension of average maturity and rise in average amount financed
One bright spot in the current U.S. expansion has been auto sales.
Since peaking at a seasonally adjusted annual rate of 20.6 million units in July 2005, sales of light-weight vehicles (autos and light trucks) hit their nadir at nine million in February 2009. Since that Great Recession low, sales have seen quite a recovery. May came in at 17.7 million – a recovery high – followed by 17.1 million in June, with three of the last four months 17-million plus. At 16.8 million, the 12-month rolling average was at a new recovery high in June (Chart 1).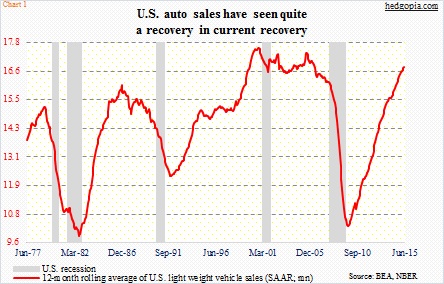
Not surprisingly, auto loans have followed suit. In 3Q10, motor vehicle loans were $698 billion. In 1Q15, they stood at $972 billion (Chart 2). Since 3Q10, they have enjoyed sequential growth every single quarter. Some momentum! Not to mention the humongous size it has gotten to. Although one would fail to notice this by just looking at the red line in that chart.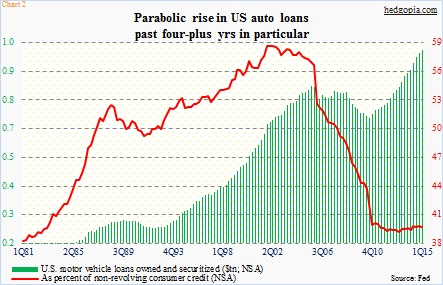
As a percent of total non-revolving consumer credit, the share of auto loans is at multi-decade lows. In 1Q15, non-revolving consumer credit was $2.5 trillion, of which auto loans made up 39.3 percent. This is higher than the low of 38.8 percent in 1Q13, but historically remains suppressed (Chart 2).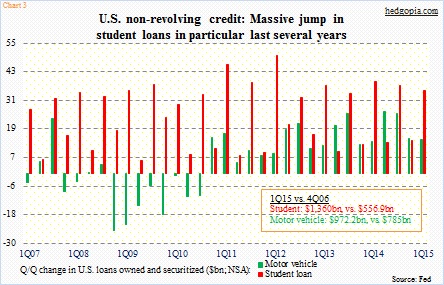
The answer lies in Chart 3. Surging student loans over the years have contributed greatly to non-revolving credit growing much faster than auto loans. Not that the latter is growing any slower. But it is just that student loans have been growing at a much faster rate. In 2Q09, as the Great Recession ended, motor-vehicle loans were $742 billion and student loans $771 billion. In 1Q15, the former had jumped to $972 billion, while the latter had ballooned to $1.36 trillion. In Chart 3, the red bars are consistently taller than the green bars.
To some, the persistent increase in auto loans comes as a surprise, considering the economy still acts tentative. In the current expansion, real GDP has managed to grow at a seasonally adjusted annual rate of 2.2 percent, versus an average of 3.3 percent going back to 1947. The low unemployment rate probably does not reflect the true state of the economy.
With that said, the average age of all-light vehicles in the U.S. reached 11.4 years in 2013, and that probably helped spur sales. However, in an economy as sluggish as has been post-Great Recession, the push for auto sales probably also came from other sources.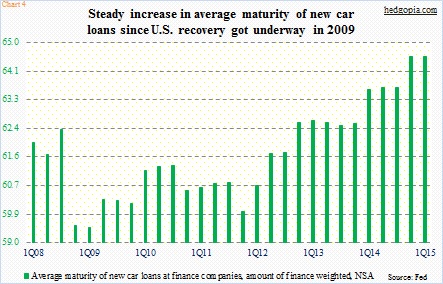
Chart 4 is one. The green bars represent the average maturity of new car loans. In 1Q15, it stood at 64.6 months, versus 59.46 in 1Q09. The longer the maturity, the lower the monthly payment. Plus, it potentially helps draw buyers at the periphery. Too much reliance on the latter – if this is what is going on – is never a good thing. A corollary question is, how high can the red line in Chart 1 go given how extended it looks already?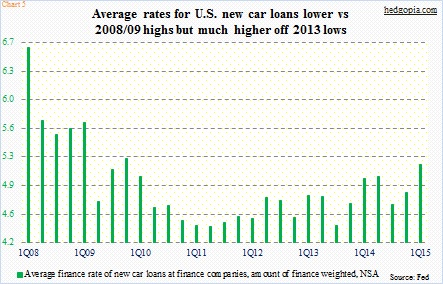
In this respect, Chart 5 is relevant. The average finance rate of new car loans, thanks to the Fed’s zero interest-rate policy, has come down quite a bit from 2008/2009 levels. Nonetheless, since 3Q13 it has been rising. And then we have a Fed that seems determined to at least begin to raise rates later this year.
Charts 4 and 5 can be problem spots in a rising rate environment. And Chart 6, to some extent. The average amount financed for new car loans has persistently risen in the current recovery. Back in 2Q09, the amount was $25,657. By 1Q15, this had risen to $27,272. Once again, both Charts 4 and 5 probably played a role. Responding to relatively lower rates combined with longer maturity, consumers seem to be splurging a little. All good – until the next downturn hits. The latter three charts are signs that things are beginning to get stretched. When the cycle turns – whenever that is – it can be messy.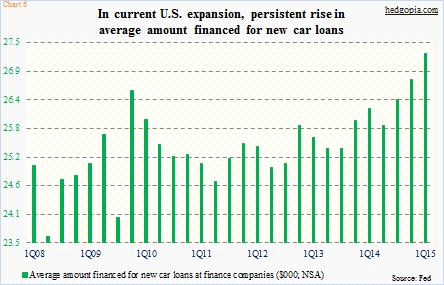
In June’s retail sales report yesterday, the ‘motor vehicles & parts dealers’ category dropped 1.1 percent month-over-month but rose 6.5 percent year-over-year to $91.8 billion. May was $92.8 billion – an all-time high. Auto activity is still going strong. Nothing is forever, enjoy it while it lasts.
Thanks for reading!
