
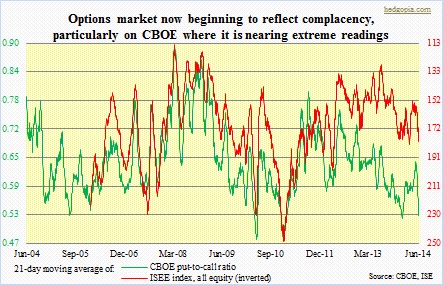
 How quickly the pendulum has swung the other way. When we last discussed signals coming out of the options market, the CBOE in particular was giving out signs that equities were itching to go higher. Nearly a month ago, the 21-day moving average of the CBOE put-to-call ratio hooked down well before getting to extreme overbought conditions. Demand for calls were simply overwhelming those for puts. In the 14 sessions so far this month, the straight put-to-call ratio has only had one reading in the 60s, the rest are in the 50s and 40s, with one reading on the 18th of 0.38! The 21-day moving average as a result is now in the low-50s. Historically, with some exceptions, that has consistently been a level against which equities struggle to gain traction. With one caveat. Over at the ISE, readings are not as oversold. The ISEE only measures opening long customer transactions (on ISE), and these do not include transactions made by market makers, only customer transactions. From this perspective, it is possible it better reflects market sentiment. Nevertheless, I have been tracking the CBOE ratio long enough to realize that it is a stone’s throw away from getting to extreme overbought conditions.
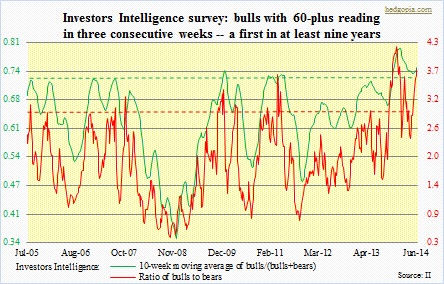 Investors Intelligence readings have stayed overbought for a while now, and just recorded another first. For the first time since at least mid-July 2005, bulls have been in the low 60s for three consecutive weeks. Only twice in the last nine years have bulls’ percent been in the 60s in two consecutive weeks – once early this year and the other in October 2007. The market peaked that very month. In several weeks/months leading up to that October 2007 peak, the 10-week moving average of bulls/(bulls+bears) persistently stayed in the low 70s. This time around, that metric has been in the 70s since mid-November last year, with even readings of high 70s/low 80s late last year/early this year! In the past, low-70s has consistently been a time to get cautious on equities. The ratio of bulls to bears conveys the same message – extreme bullish sentiment, yet that has not stopped the metric from either staying there or getting even more overbought.
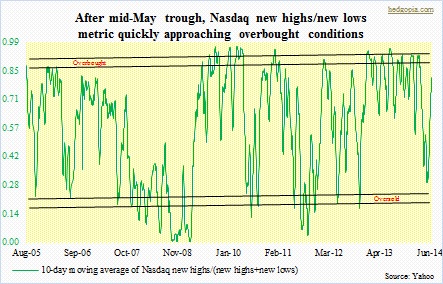 Thanks to central-bank activism, market participants have largely thrown the word caution out the window. Because investors/traders are so heavily leaning one way, when this musical-chair game ends – it is not a matter of if – it is bound to be ugly. But for now, that is the least of worries. Rather the focus – rightly or wrongly – seems to be not to want to miss a rally, and that sentiment feeds on itself. In the accompanying chart, the 10-day moving average of Nasdaq new highs/(new highs+new lows) bottomed mid-May and in no time at all has gotten very close to getting overbought. Kudos to large speculators who were betting on more upside on the Nasdaq 100 in the futures market. Turns out that was the right strategy to pursue. Though the fact remains that NDX continues to lag its larger brethren – the Nasdaq – as well as the S&P 500. This is only one of several divergences out there. But it has not mattered, until it does, of course.
