US companies are sitting on tons of cash, and are also spending tons in dividends and buybacks. As they continue to pay back shareholders, debt load – rising – moves front and center.
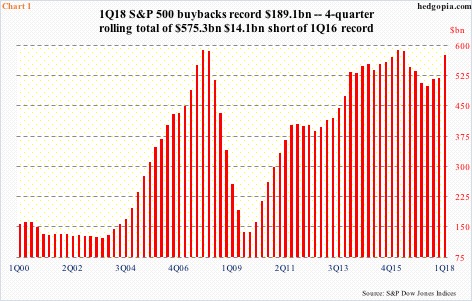
S&P 500 buybacks shot up to new record in 1Q18. Companies purchased $189.1 billion worth of their own shares, easily surpassing the prior quarterly record of $172 billion in 3Q07. In the current cycle, the prior high was recorded in 1Q16 when $161.4 billion was spent, subsequent to which buybacks came under pressure, dropping to $120.1 billion by 2Q17.
As a result, the four-quarter rolling total in 1Q18 came in at $575.3 billion, still lower than the all-time high of $589.4 billion in 1Q16. The latter was just about on par with the high of $589.1 billion recorded in 4Q07 in the previous cycle (Chart 1).
The Tax Cuts and Jobs Act of 2017, which was passed into law last December, provides for repatriation of overseas cash at favorable rates. The current pace of buybacks likely continues. Ditto with dividends.
In 1Q18, S&P 500 companies distributed $109.2 billion in dividends, just shy of the record $109.5 billion in 4Q17. In each of the last six quarters, dividends exceeded $100 billion.
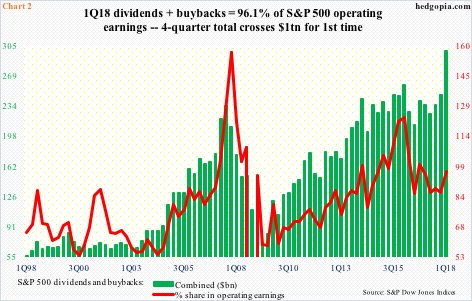
Chart 2 combines dividends and buybacks and calculates the percentage share spent in the two out of operating earnings. In 1Q18, a combined $298.2 billion was spent – a new record. Operating earnings were $310.3 billion during the quarter. Thus, a whopping 96.1 percent of earnings went toward dividends and buybacks. The pace is clearly not sustainable. In fact, on a rolling four-quarter basis, 1Q18 was the first quarter more than $1 trillion was spent in dividends and buybacks combined.
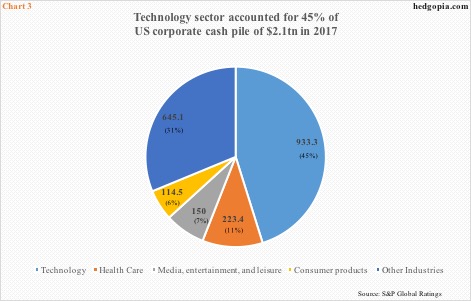
Given current corporate earnings and the amount of cash available, markets currently are not too focused on what is being handed out in dividends and buybacks. S&P Global Ratings puts US corporate cash and investments at $2.1 trillion in 2017, up nine percent over 2016. This was based on its universe of nearly 1,900 rated non-financial companies.
Not surprisingly, the cash horde is top-heavy, with the top one percent owning nearly $1.2 trillion. Sector-wise, technology controls $933.3 billion, accounting for 45 percent of the total (Chart 3). The top-five consists of Apple, Microsoft, Alphabet, Cisco and Oracle – all tech – and together held $672.7 billion.
As companies get ready to repatriate their offshore cash and return it to shareholders, the cash pile in due course will shrink. S&P Global Ratings says $1.3 trillion of the $2.1 trillion was held offshore. Apple – the largest cash holder at $285.1 billion ($162.7 billion net of debt) – already said its plan was to become net cash neutral over time.
Thus the need to also focus on the other side of the ledger.
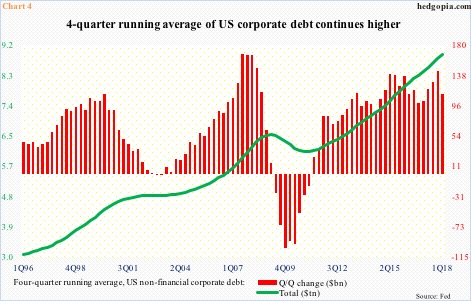
As per S&P Global Ratings, total outstanding debt of these companies was $6.3 trillion in 2017. This may not be directly comparable to the non-financial corporate debt as shown in the Fed’s quarterly Z.1 report, but directionally they are headed the same way – up. The latter in 1Q18 showed $9.1 trillion, up $89.1 billion sequentially (Chart 4). Since Great Recession ended, debt has gone up by $2.6 trillion. On a four-quarter running average basis, 1Q18 was $8.9 trillion. The ascent has been sharp since 3Q11.
It is not even worth guessing when markets will begin to worry about this debt load. Right now, earnings are decent and cash pile healthy. Risks increasingly rise as the economic cycle matures more and more, more so as a decreasing cash pile provides less and less cushion.
Thanks for reading!

